Dec-2025
Sales
Trend
6-Month
Product Count
SKUs
Avg Price
YoY Sales Change
YoY Price Change
Market Insights Snapshot
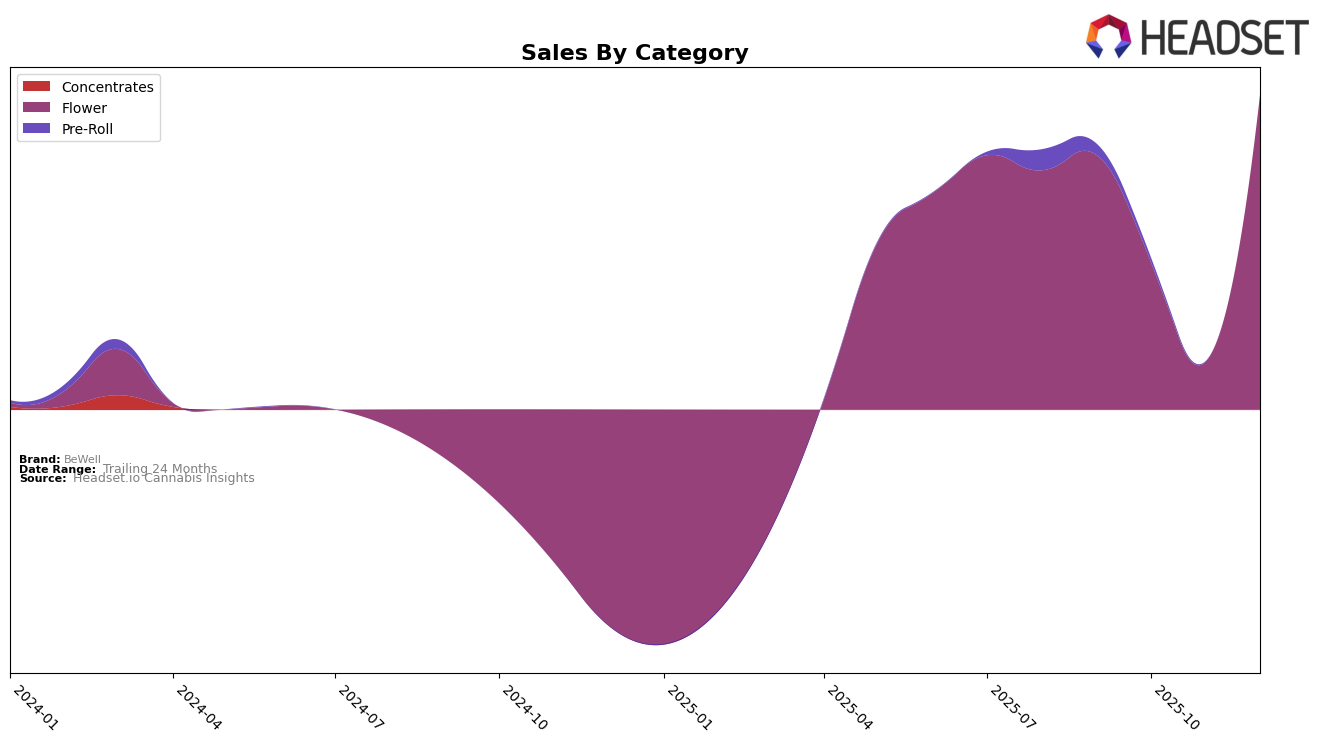
In the state of Massachusetts, BeWell has experienced notable fluctuations in its performance within the Flower category over the last few months of 2025. After starting at rank 41 in September, BeWell's ranking slipped to 60 in October, indicating a decline in their market presence. However, by December, the brand made a significant recovery, climbing to rank 29. This improvement suggests a successful strategy adjustment or increased consumer preference during the holiday season. The absence of a ranking in November suggests that BeWell did not make it into the top 30 brands, which could have been a strategic withdrawal or a result of heightened competition.
Analyzing the sales figures, BeWell's Flower category sales in Massachusetts showed a decline from September to October, dropping from $365,884 to $211,857. This drop might have been due to increased competition or seasonal demand fluctuations. However, by December, sales rebounded to $453,224, reflecting a strong end-of-year performance. This positive trend in December could be attributed to successful marketing campaigns, product launches, or increased consumer spending during the holiday period. The fluctuations in rankings and sales highlight the dynamic nature of the cannabis market in Massachusetts, where BeWell appears to be adapting to maintain its competitive edge.
Competitive Landscape
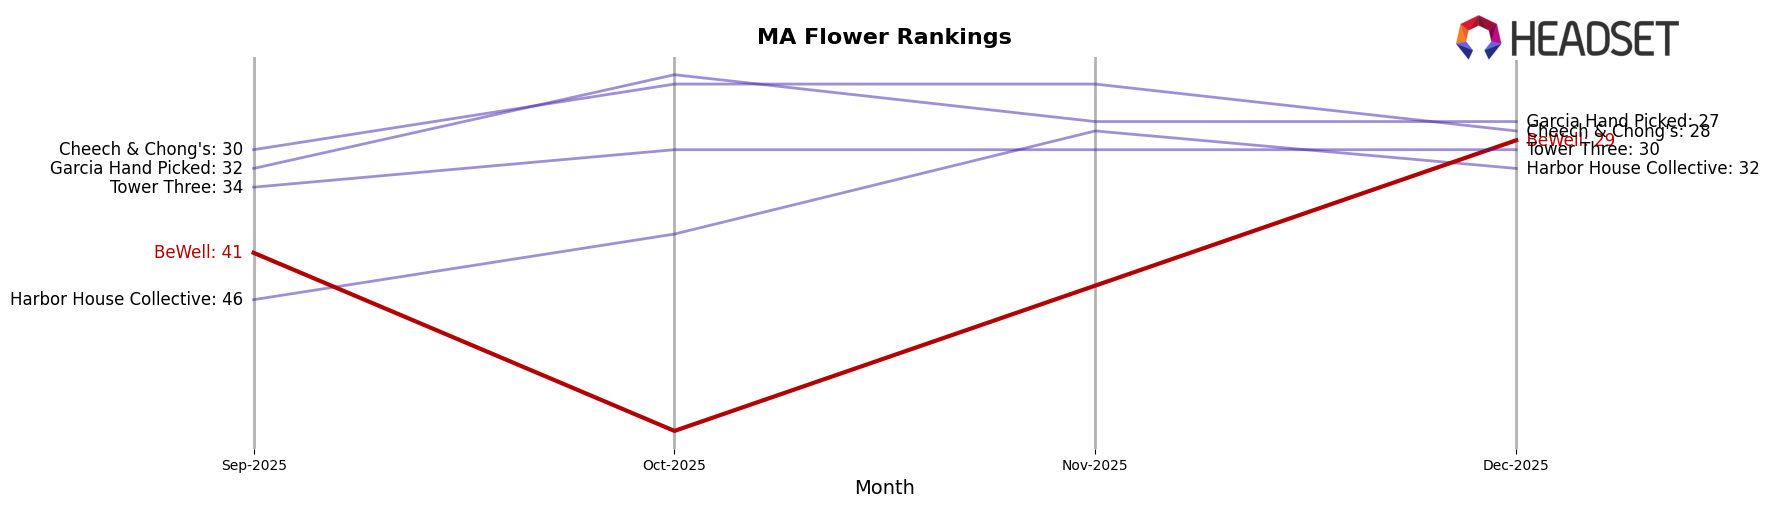
In the Massachusetts flower category, BeWell experienced significant fluctuations in its ranking and sales performance from September to December 2025. Notably, BeWell's rank plummeted from 41st in September to 60th in October, indicating a challenging period, potentially due to increased competition or market dynamics. By December, BeWell rebounded to 29th, suggesting a recovery or strategic adjustments that improved its market position. In contrast, competitors like Garcia Hand Picked and Cheech & Chong's maintained relatively stable rankings, consistently appearing in the top 30, which may have pressured BeWell's market share. Harbor House Collective also showed a positive trend, climbing from 46th in September to 28th in November, potentially capturing some of BeWell's market share during its downturn. These dynamics highlight the competitive landscape BeWell faces, emphasizing the need for strategic initiatives to sustain and enhance its market position in Massachusetts.
Notable Products
In December 2025, BeWell's top-performing product was Singapore Sling (3.5g) in the Flower category, securing the number one rank with notable sales of 5618 units. Mac n Cheese (3.5g) followed closely in second place, marking its debut in the top ranks. Bubba Fett (3.5g) slipped from its consistent first position in the previous months to third place, despite a sales increase to 4949 units. Apple Fritter (3.5g) maintained its fourth position from October, showing steady performance. Bad n Boujee (3.5g) entered the top five for the first time, indicating a rising trend in popularity.
Top Selling Cannabis Brands
Data for this report comes from real-time sales reporting by participating cannabis retailers via their point-of-sale systems, which are linked up with Headset’s business intelligence software. Headset’s data is very reliable, as it comes digitally direct from our partner retailers. However, the potential does exist for misreporting in the instance of duplicates, incorrectly classified products, inaccurate entry of products into point-of-sale systems, or even simple human error at the point of purchase. Thus, there is a slight margin of error to consider. Brands listed on this page are ranked in the top twenty within the market and product category by total retail sales volume.

