Market Insights Snapshot
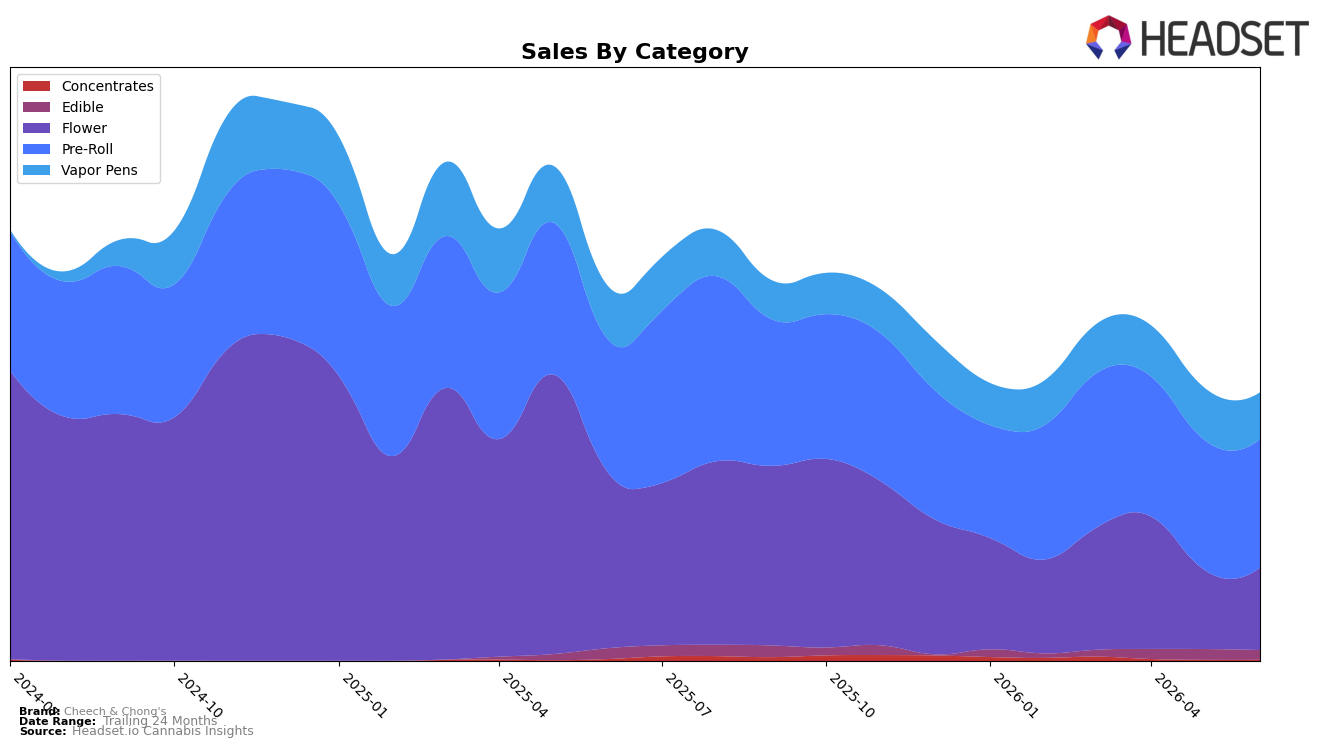
In June 2026, Cheech & Chong's mix is concentrated in Pre-Roll at 47.92% share with category sales down 3.48% year over year and 1.13% month over month, while Flower holds 30.72% share with a 53.03% year-over-year decline but a 4.43% month-over-month uptick. Vapor Pens account for 17.34% share with sales down 12.67% year over year and 10.57% month over month, and Edible at 3.54% share fell 10.17% year over year and 9.67% month over month; Concentrates sit at 0.47% share, down 39.57% year over year and 0.75% month over month. This mix, paired with a 30.41% year-over-year drop in average price and a total brand year-over-year sales decline of 28.39%, implies the brand is leaning into lower-ticket Pre-Roll volume while absorbing outsized contraction in Flower, signaling a pivot toward value-led formats as higher-priced segments recede.
The combination of a stable yet slightly eroding Pre-Roll core (ranked 8 in Pre-Roll within Arizona) and a tentative Flower rebound month over month (+4.43%) suggests near-term positioning around accessibility and basket-filler roles rather than premium trade-ups; the 1.13% Pre-Roll month-over-month dip alongside a 10.57% Vapor Pens month-over-month decline points to price-sensitive switching within inhalables. With Pre-Roll nearly half of sales and Vapor Pens and Edible both posting mid-to-high single-digit to double-digit month-over-month declines (10.57% and 9.67%, respectively), the path forward likely centers on defending share in high-frequency value segments while selectively testing Flower SKUs where the monthly improvement indicates recoverable demand.
Competitive Landscape
Cheech & Chong's ranks #27 in MI Pre-Roll in June 2026, improving 8 places from #35 year over year, yet slipping 5 spots from #22 in March 2026 as it remains 12 places below its peak at #15 in November 2025; in contrast, Mitten Extracts climbed from #8 to #4 while expanding sales by 114.4%, and Jeeter held #1 year over year despite a 7.9% sales decline, indicating Cheech & Chong's recovery pace lags winners moving up the leaderboard. With Cali-Blaze steady at #2 despite a 33.1% sales drop and Goodlyfe Farms sliding from #4 to #5 alongside a 32.3% contraction, the mixed top-tier momentum suggests a shake-up that rewards brands with accelerating share; the trajectory implies Cheech & Chong's is stabilizing versus last year but must convert the YoY rank gain into month-to-month climbs to avoid ceding ground to faster risers.

Notable Products
Pink Champagne Cryo Infused Pre-Roll (1.2g) took the steepest hit in June 2026 with a -21.1% MoM drop while holding rank 4, as Jack Herer Infused Pre-Roll (1.2g) similarly slid -19.8% to rank 6, indicating downshift among legacy hero SKUs despite top-three stability. At the top, Key Lime Pie Infused Pre-Roll (1.2g) rose 15.1% MoM to rank 1 and Granddaddy Purple Infused Pre-Roll (1.2g) climbed 18.2% to rank 2, while Sour Pebbles Injected Infused Pre-Roll (1.2g) dipped -7.0% at rank 3, concentrating momentum in just two leaders. With eight of the top ten in the Infused Pre-Roll family and only two standard Pre-Rolls in ranks 9–10, the mix tilts toward higher-potency formats, implying Cheech & Chong's is leaning into infused dominance to offset volatility among mid-tier flavors and protect premium price realization around $90,080 at the category peak.
Top Selling Cannabis Brands
Data for this report comes from real-time sales reporting by participating cannabis retailers via their point-of-sale systems, which are linked up with Headset’s business intelligence software. Headset’s data is very reliable, as it comes digitally direct from our partner retailers. However, the potential does exist for misreporting in the instance of duplicates, incorrectly classified products, inaccurate entry of products into point-of-sale systems, or even simple human error at the point of purchase. Thus, there is a slight margin of error to consider. Brands listed on this page are ranked in the top twenty within the market and product category by total retail sales volume.

