.svg)
Aug-2026
Sales
Trend
6-Month
Product Count
SKUs
Avg Price
YoY Sales Change
YoY Price Change


Market Insights Snapshot
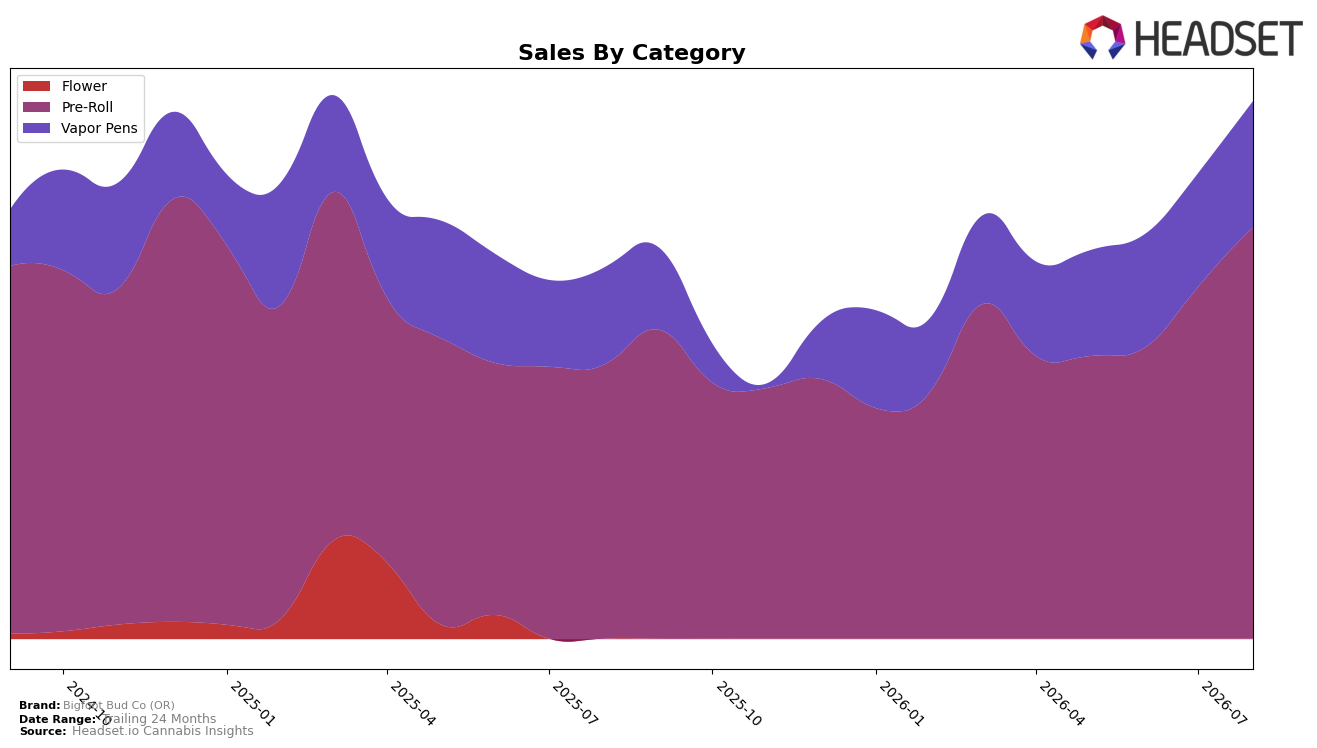
In August 2026, Bigfoot Bud Co (OR) concentrated 76.52% of sales in Pre-Roll with 23.48% in Vapor Pens, while brand-level sales grew 44.97% year over year and average price fell 15.50%. Within categories, Pre-Roll expanded 50.14% YoY and 16.99% MoM with an average price of $1.86, whereas Vapor Pens rose 30.37% YoY and 11.18% MoM at an average price of $14.40. The pattern implies the brand’s mix is tilting further toward value-led Pre-Rolls during August 2026, using price compression alongside volume gains to outpace overall brand growth.
Pre-Roll now anchors the brand’s positioning in OR, where the category rank sits at position 23 and category share within the brand sits at 76.52%, outpacing Vapor Pens at 23.48%. With Pre-Roll’s MoM growth of 16.99% exceeding Vapor Pens’ 11.18% and YoY growth of 50.14% beating Vapor Pens’ 30.37%, the brand is consolidating into a price-sensitive, high-velocity Pre-Roll posture that can defend and potentially improve a rank of 23 if mix-driven momentum continues.
Competitive Landscape
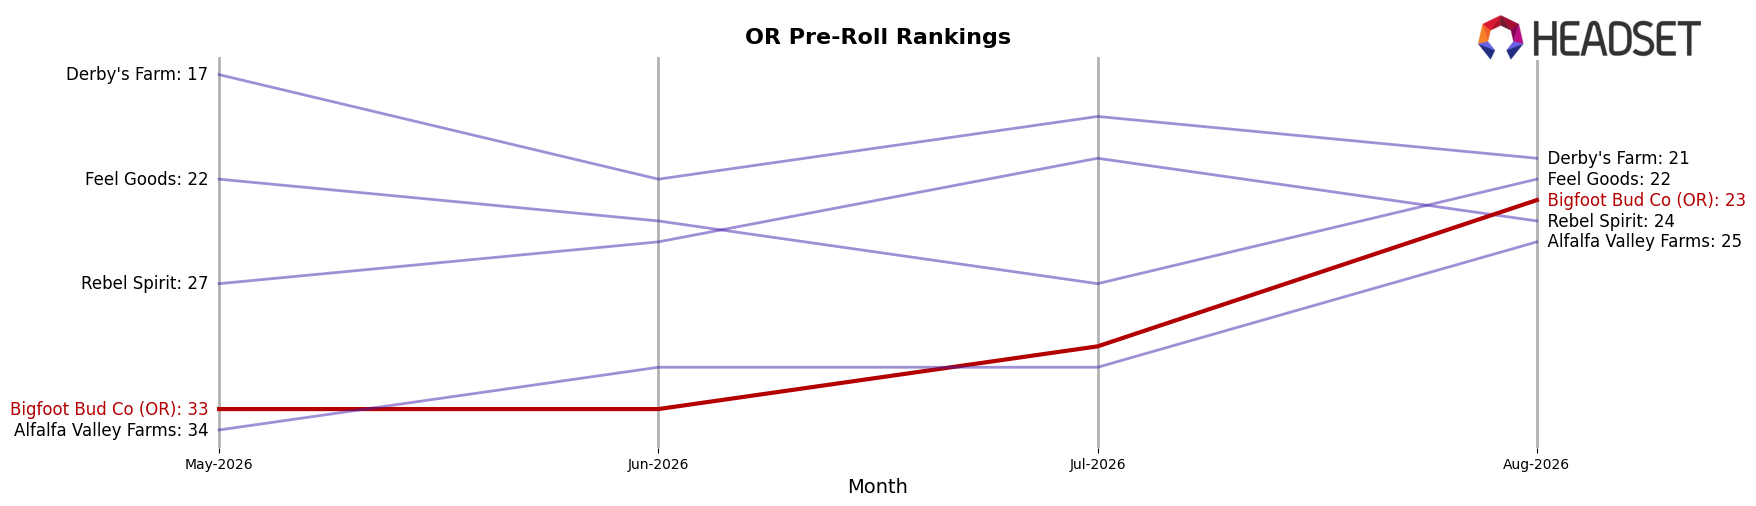
Bigfoot Bud Co (OR) sits at rank 23 in OR Pre-Roll in August 2026, improving 12 spots from rank 35 year over year, while rising 10 places versus May 2026 when it was rank 33, and sitting just one position below its historical peak rank of 22 from December 2024 implies momentum rather than a one-off spike. In contrast, STiCKS held at #1 year over year with a 96.2% YoY sales increase, and Kaprikorn climbed from #5 to #2 with 128.9% YoY growth, whereas Hellavated slid from #2 to #3 alongside a 19.9% YoY sales decline; against this bifurcated competitive field, Bigfoot Bud Co (OR)’s move from #35 to #23 and from #33 three months ago indicates it is participating in share consolidation from weaker mid-tier players rather than chasing the hyper-growth top two.
Notable Products
Green Crack Pre-Roll (0.5g) posted the steepest move in August 2026 with a -52.2% month-over-month drop while falling to rank 6, whereas Kiwi Sherbert Pre-Roll (0.5g) surged +43.9% to rank 3, signaling a bifurcation within half-gram Pre-Rolls. Jack Herer Pre-Roll (1g) advanced +24.0% to rank 2 alongside a $18,362 tally, and nine of the top ten are Pre-Rolls with two SKUs tied at rank 8, indicating concentration in a single format with mixed velocity among sizes. Purple Punch Pre-Roll (Half Gram) held rank 1 despite no reported month-over-month figure, contrasting with Sundae Driver PreRoll (0.5g) down -35.2% at rank 8, which implies flavor-specific volatility outweighs a uniform size or price effect. The pattern implies Bigfoot Bud Co (OR) is leaning into a Pre-Roll-led lineup where success will depend on culling underperforming half-gram strains and reallocating push toward faster-moving names that can defend top-3 ranks.
Top Selling Cannabis Brands






Data for this report comes from real-time sales reporting by participating cannabis retailers via their point-of-sale systems, which are linked up with Headset’s business intelligence software. Headset’s data is very reliable, as it comes digitally direct from our partner retailers. However, the potential does exist for misreporting in the instance of duplicates, incorrectly classified products, inaccurate entry of products into point-of-sale systems, or even simple human error at the point of purchase. Thus, there is a slight margin of error to consider. Brands listed on this page are ranked in the top twenty within the market and product category by total retail sales volume.

