.svg)

Sep-2026
Sales
Trend
6-Month
Product Count
SKUs
Avg Price
YoY Sales Change
YoY Price Change




Where to Buy
BITS is stocked at 257 licensed dispensaries across New Jersey, Maryland, and 7 other states, 70 of them in New Jersey, with the deepest coverage in Atlantic City, Jersey City, Camden, Egg Harbor Township, and Evesham. Search by ZIP code or city below to find the closest one.
Market Insights Snapshot
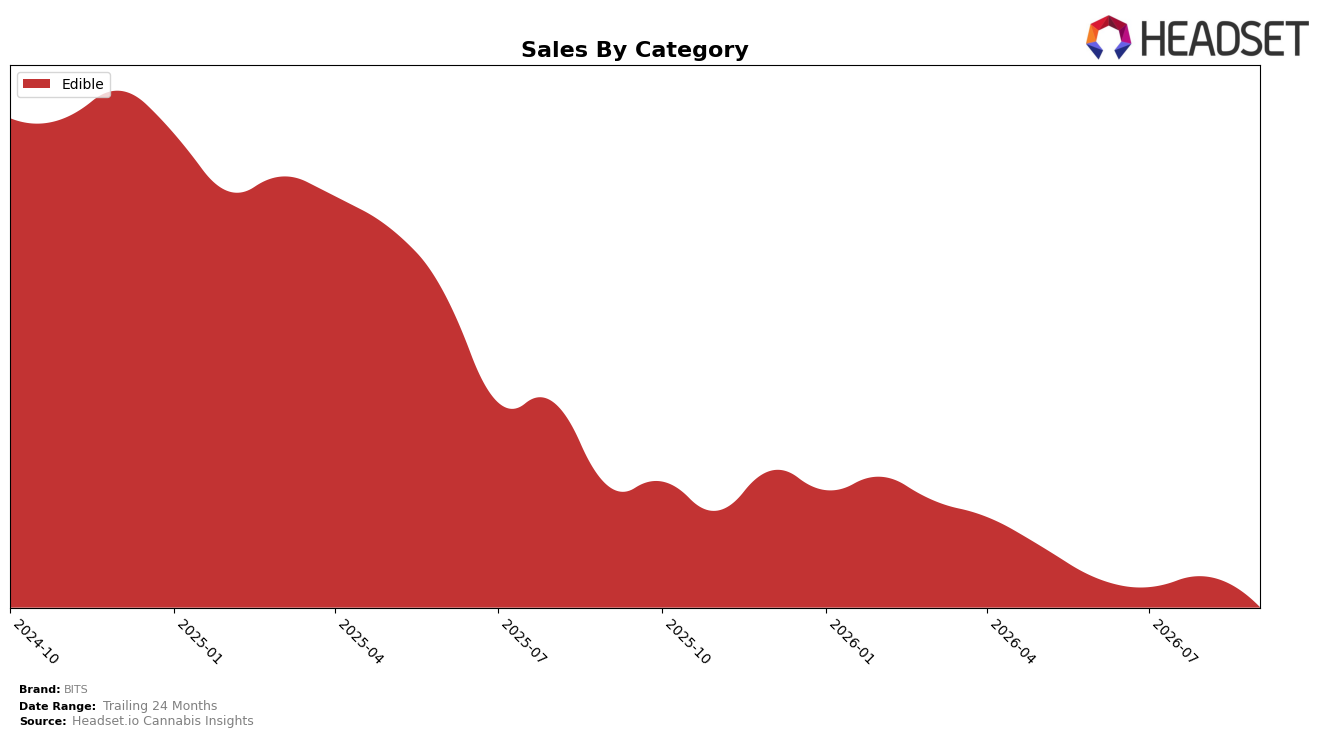
In September 2026, BITS operated as a single-category brand with Edible at 100.0% of sales share, while Edible sales were down 47.6% year over year and 18.8% month over month. Average price decreased 6.7% year over year to $18.10, coinciding with a 47.6% year-over-year sales decline and a 78.7% two-year drop, indicating that mix concentration in Edible did not buffer volume declines. The thesis is that a fully concentrated category mix magnified exposure to a downtrend, with the 18.8% month-over-month contraction and 47.6% year-over-year decline signaling elasticity or distribution pressure that price cuts did not offset.
BITS held rank 14 in Edible in Connecticut, pairing a mid-pack position with a 100.0% reliance on the category, which compounds risk if rank slips further by even 2–3 positions or if month-over-month declines persist near 18–20%. With average price down 6.7% year over year and no diversification outside Edible, the brand’s positioning tilts toward defensive share retention rather than premium margin capture, implying that sustaining rank 14 or improving it requires either mix expansion or sharper price-pack architecture to counter a 47.6% annual sales decline.
Competitive Landscape
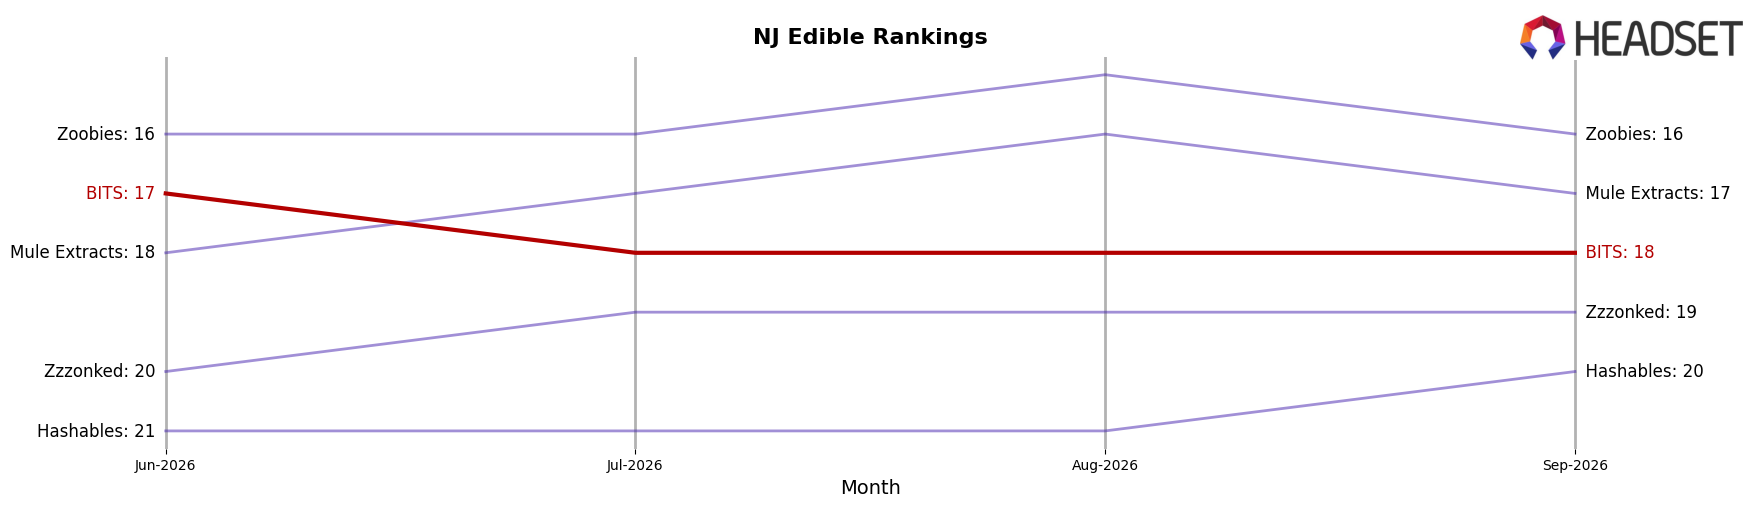
BITS ranks #18 in New Jersey Edible for September 2026, down 2 positions year over year from #16 and off 1 spot from June 2026’s #17, while still far below its peak of #4 in September 2024; in contrast, Wyld climbed from #3 to #2 and grew sales 6.0% year over year as Select fell from #2 to #4 with a 35.8% decline, and category leader Gron / Grön remained #1 despite a 14.4% sales drop. The mix of a modest rank slip for BITS alongside upward movement by Wyld and a retreat by Select implies BITS’ trajectory is drifting sideways-to-down, signaling share pressure unless it reclaims momentum from competitors that are either holding top ranks or gaining despite category turbulence.
Notable Products
Guava Go Gummies 20-Pack (100mg) led the downturn in September 2026 with a -24.1% MoM slide while holding rank 4, and the category’s leader CBN/THC 1:1 Pomegranate R&R Gummies 20-Pack (100mg CBN, 100mg THC) fell -13.4% at rank 1. CBD/THC 1:1 Elderberry Wellness Gummies 20-Pack (100mg CBD, 100mg THC) declined -21.3% at rank 2 versus the niche CBD/THC 1:1 Acai Affection Gummies 20-Pack (100mg CBD, 100mg THC), which was the only SKU near a +50.1% MoM gain at rank 8, indicating rotation within the 1:1 sub-line rather than category-level growth. With all top 10 items in Edible and seven of the top eight in cannabinoid 1:1 formats, concentration is high despite Dragonfruit RSO Gummies 20-Pack (100mg) dropping -37.1% at rank 7 and the flagship still generating $71,910, pointing to reliance on a narrow functional gummy portfolio that is sensitive to flavor mix shifts.
Top Selling Cannabis Brands






Data for this report comes from real-time sales reporting by participating cannabis retailers via their point-of-sale systems, which are linked up with Headset’s business intelligence software. Headset’s data is very reliable, as it comes digitally direct from our partner retailers. However, the potential does exist for misreporting in the instance of duplicates, incorrectly classified products, inaccurate entry of products into point-of-sale systems, or even simple human error at the point of purchase. Thus, there is a slight margin of error to consider. Brands listed on this page are ranked in the top twenty within the market and product category by total retail sales volume.

