.svg)

Sep-2026
Sales
Trend
6-Month
Product Count
SKUs
Avg Price
YoY Sales Change
YoY Price Change


Where to Buy
New York Honey (NY Honey) is stocked at 152 licensed dispensaries across New York, with the deepest coverage in New York, Brooklyn, Queens, Rochester, and Staten Island. Search by ZIP code or city below to find the closest one, or filter by product type if you are after a specific format.
Market Insights Snapshot
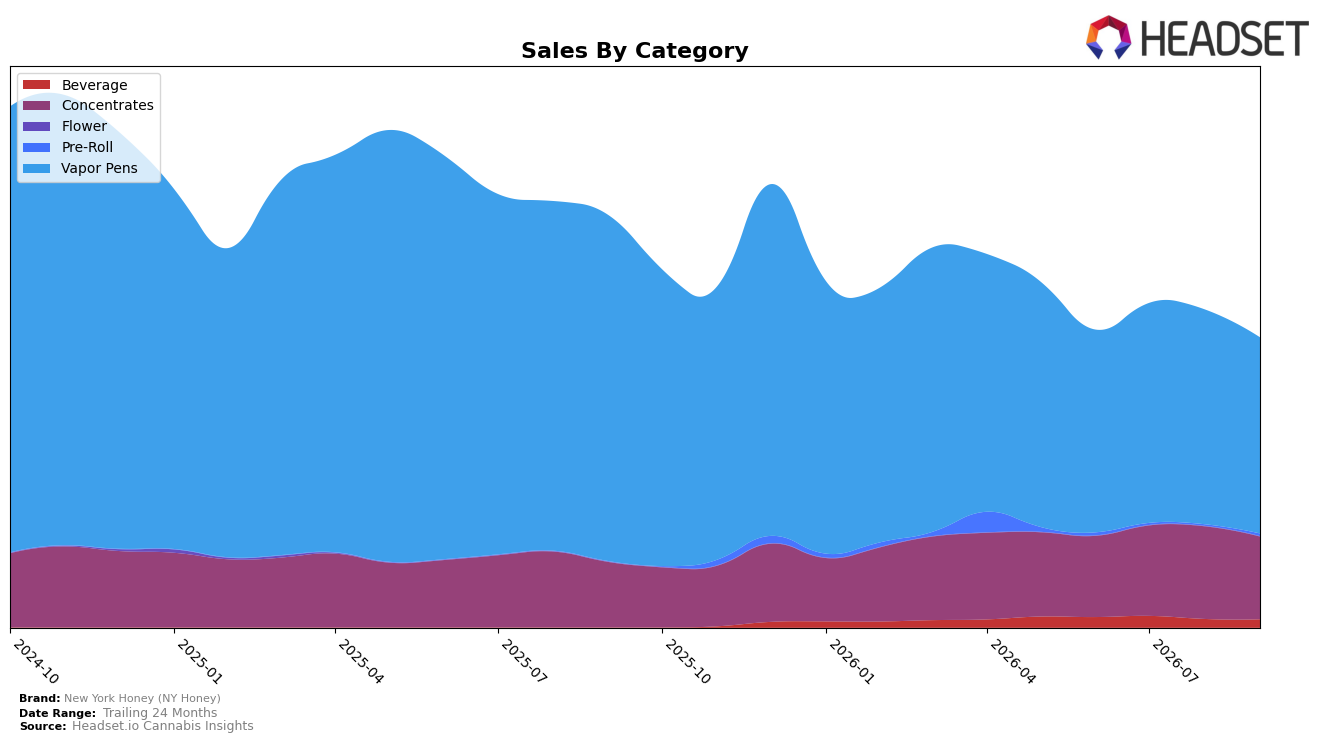
In September 2026, New York Honey (NY Honey) concentrated 67.88% of sales in Vapor Pens while allocating 28.54% to Concentrates, with residual exposure in Beverage at 2.82% and Pre-Roll at 0.76%; within this mix, Vapor Pens declined 43.37% year over year and 8.73% month over month, whereas Concentrates rose 26.54% year over year but fell 10.75% month over month. Despite a 23.91% drop in average price and a brand-level year-over-year sales contraction of 29.79%, the category split indicates a pivot away from the historically dominant Vapor Pens toward a growing Concentrates contribution, implying dependence on a smaller but expanding sub-portfolio to counterbalance core erosion.
These shifts place New York Honey (NY Honey) at rank 27 in Vapor Pens in New York, suggesting that the brand’s primary shelf position is weakening even as Concentrates gain relevance; with Vapor Pens still two-thirds of volume and down 43.37% year over year, the aggregate trajectory is governed by the largest category’s decline rather than the 26.54% year-over-year lift in Concentrates. The combination of an 8.73% month-over-month slide in Vapor Pens and a simultaneous 10.75% month-over-month pullback in Concentrates signals short-term pressure across both pillars, implying that stabilization will require either further mix reallocation toward higher-growth niches or price/assortment adjustments to arrest share loss within the core.
Competitive Landscape
New York Honey (NY Honey) sits at rank 27 in September 2026, sliding 13 positions from rank 14 year over year, and drifting 1 spot from rank 26 since June 2026; the brand is now 16 places below its peak at rank 11 from May 2025. In contrast, Fernway advanced to rank 1 from rank 3 year over year while growing sales 18.1%, and Jetty Extracts surged to rank 5 from rank 28 with a 289.4% sales increase, indicating that NY Honey’s relative decline is tied less to broad category softness and more to share capture by faster-ascending rivals; the implied trajectory is further slippage unless NY Honey reverses YoY rank erosion and narrows the 22-rank gap to the top five.

Notable Products
Barry White Distillate Cartridge (1g) posted the steepest decline in September 2026 at -11.6% while sliding to rank 3, contrasting with Golden Ticket Distillate Disposable (1g) up 23.5% at rank 2. Blue Dream Distillate Cartridge (1g) held rank 1 despite a -7.4% drop, and Mimosa Distillate Cartridge (1g) fell -10.8% at rank 6. With seven of the top ten in Vapor Pens, the mix tilts toward cartridge and disposable formats, implying New York Honey (NY Honey) is consolidating around inhalables even as certain legacy SKUs lose momentum.
Top Selling Cannabis Brands






Data for this report comes from real-time sales reporting by participating cannabis retailers via their point-of-sale systems, which are linked up with Headset’s business intelligence software. Headset’s data is very reliable, as it comes digitally direct from our partner retailers. However, the potential does exist for misreporting in the instance of duplicates, incorrectly classified products, inaccurate entry of products into point-of-sale systems, or even simple human error at the point of purchase. Thus, there is a slight margin of error to consider. Brands listed on this page are ranked in the top twenty within the market and product category by total retail sales volume.

