Jun-2026
Sales
Trend
6-Month
Product Count
SKUs
Avg Price
YoY Sales Change
YoY Price Change
Market Insights Snapshot
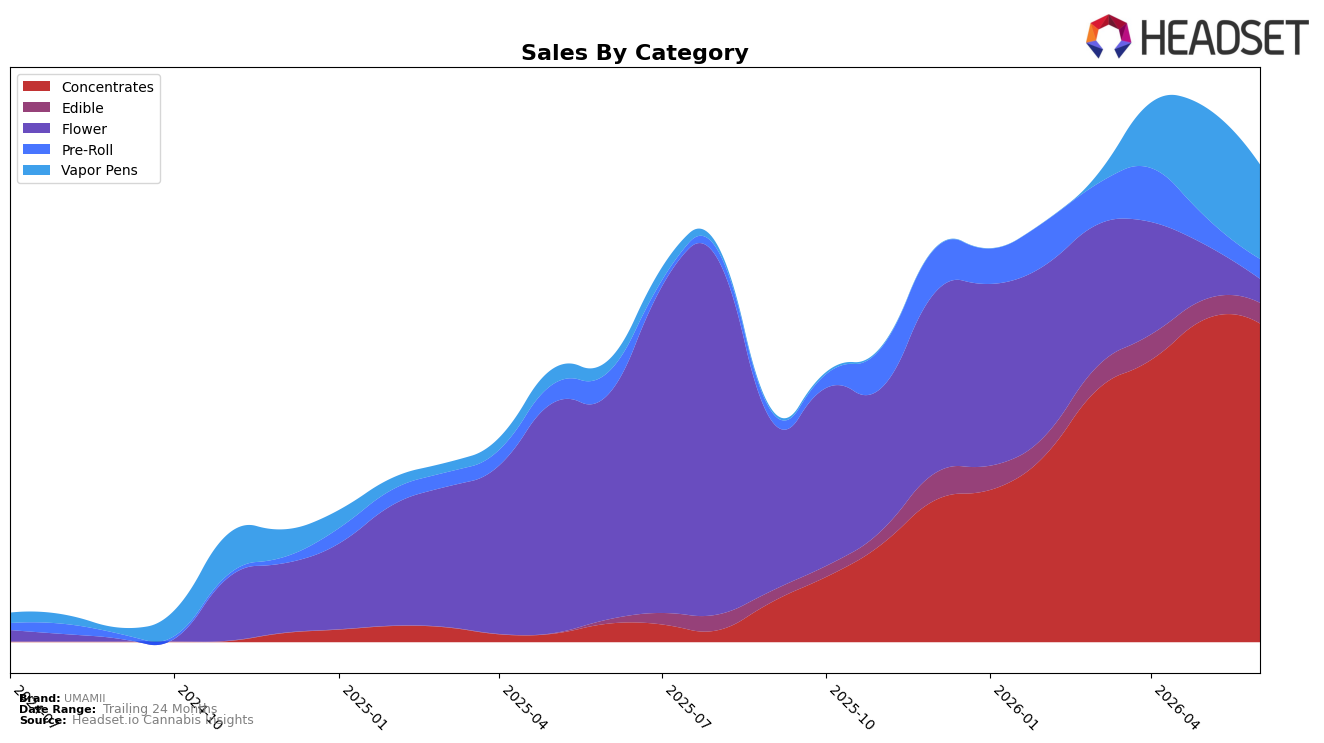
In June 2026, UMAMII’s mix tilted heavily to Concentrates at 66.88% share with year-over-year growth of 1,648.29% but a month-over-month dip of 1.26%, while Vapor Pens held 19.77% share with 719.04% YoY growth and a 13.65% MoM decline. Edible sat at 4.27% share with 421.20% YoY growth and a 3.73% MoM increase, contrasted by Flower at 4.97% share with an 89.47% YoY contraction and a 56.78% MoM drop, and Pre-Roll at 4.11% share with a 10.79% YoY decline and a 30.26% MoM fall. With average price up 52.95% YoY to $50.17 alongside a Concentrates-led revenue base, the pattern implies deliberate premiumization toward high-ticket formats while pruning lower-margin combustion products.
The shift concentrates demand into fewer, higher-price units: Concentrates’ 66.88% share paired with a 1.26% MoM pullback and Vapor Pens’ 13.65% MoM decline indicate short-term elasticity at elevated price points, while Edible’s 3.73% MoM gain and 421.20% YoY rise suggest a complementary, lower-price entry path that buffers volatility. Holding rank 3 in New York Concentrates with category-average pricing of $63.40 and brand-wide average pricing up 52.95% YoY signals a positioning anchored in premium concentrates where small MoM softness is likely a pacing effect rather than share loss, implying UMAMII should defend high-margin Concentrates while selectively leaning into Edible to stabilize monthly swings.
Competitive Landscape
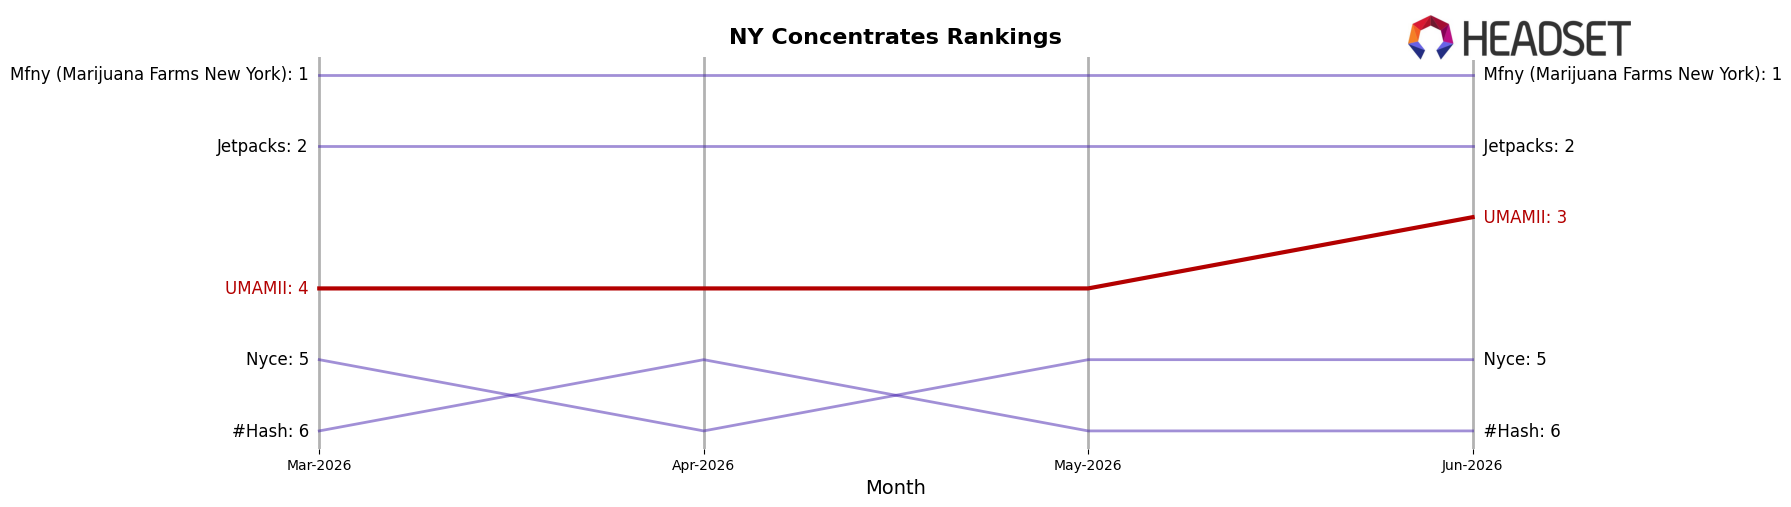
UMAMII sits at rank #3 in New York Concentrates in June 2026, improving 23 positions year over year from #26 and edging up 1 spot since March 2026 from #4 to #3; this rise coincides with Mfny (Marijuana Farms New York) holding #1 year over year at #1 and Jetpacks advancing from #4 to #2, while RYTHM sits just behind at #4 with 97.6% YoY sales growth and Nyce moves to #5 from #10 on 157.3% YoY growth; the pattern implies UMAMII’s rapid rank ascent places it in a tight share battle where maintaining #3 will require countering competitors that are either entrenched at #1 or accelerating into the top five.
Notable Products
UMAMII's Private Reserve - Wedding Cake Cold Cure Live Rosin (1g) posted the steepest movement in June 2026 with a -43.7% month-over-month drop and slid to rank 10, while Private Reserve - GMO Cold Cure Live Rosin (1g) rose +20.3% and held rank 1. Concentrates occupied 8 of the top 10 ranks and included a second-tier decline at -6.6% for Private Reserve - Strawberry Guava Live Rosin (1g), indicating concentration risk even as the lead SKU expanded share. The product mix points to a concentrate-led portfolio that hinges on one accelerating flagship amid broader softening, implying UMAMII should fortify depth in winning rosin profiles while pruning laggards.
Top Selling Cannabis Brands
Data for this report comes from real-time sales reporting by participating cannabis retailers via their point-of-sale systems, which are linked up with Headset’s business intelligence software. Headset’s data is very reliable, as it comes digitally direct from our partner retailers. However, the potential does exist for misreporting in the instance of duplicates, incorrectly classified products, inaccurate entry of products into point-of-sale systems, or even simple human error at the point of purchase. Thus, there is a slight margin of error to consider. Brands listed on this page are ranked in the top twenty within the market and product category by total retail sales volume.

