Market Insights Snapshot
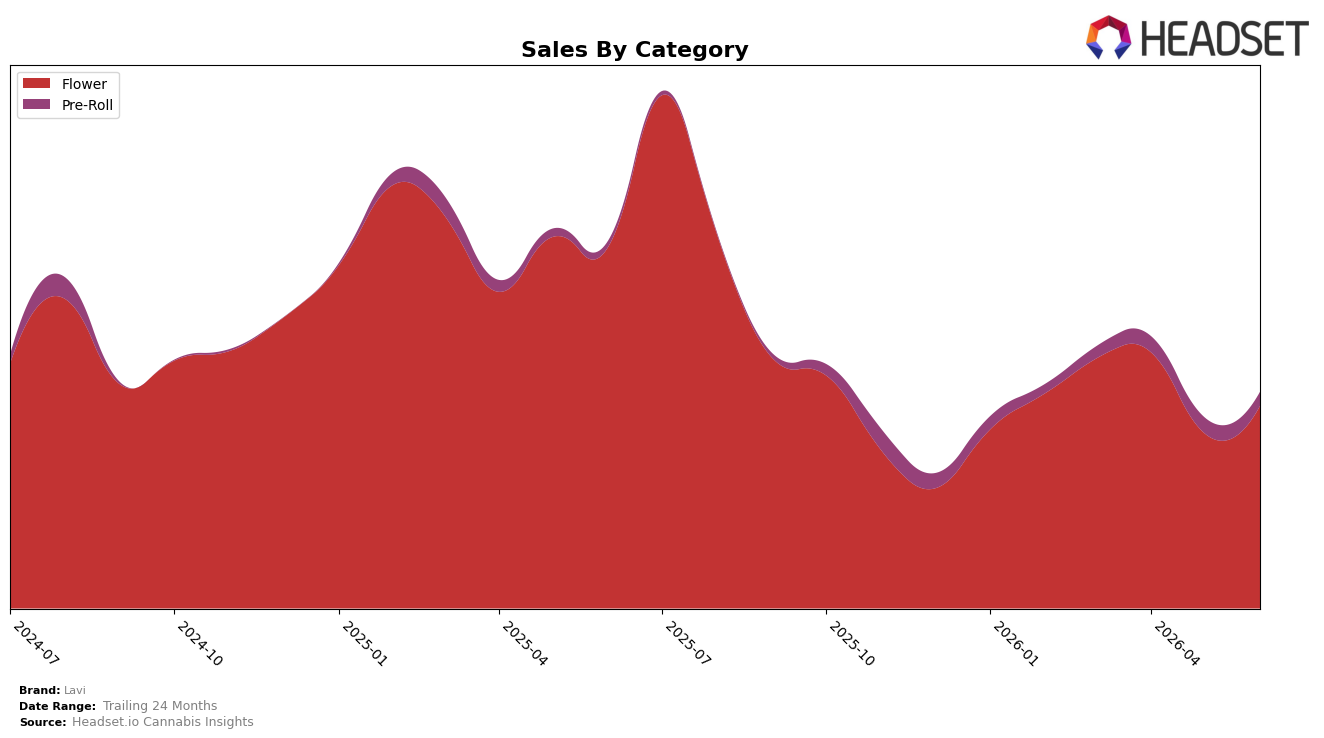
Lavi’s June 2026 mix is concentrated, with Flower at 93.58% share and Pre-Roll at 6.42%, while total brand sales fell 41.18% year over year and rose 13.30% versus 24 months. Within the mix, Flower declined 44.02% year over year but grew 15.71% month over month, whereas Pre-Roll increased 126.35% year over year but slipped 11.70% month over month; the average price dropped 25.23% year over year to $26.89. The pattern implies that June 2026 growth is being defended by a month-over-month rebound in Flower despite a steep year-over-year contraction, with Pre-Roll acting as a small but fast-cycling adjunct rather than a stable anchor.
Positionally, a June 2026 Flower rank of 11 in Nevada alongside a 93.58% category share concentrates competitive exposure at a single shelf, while the 15.71% month-over-month Flower lift contrasts with an 11.70% month-over-month Pre-Roll dip, suggesting reliance on core SKUs for near-term volume. Given a 126.35% year-over-year Pre-Roll surge against a 44.02% year-over-year Flower drop, the brand’s trajectory implies runway to diversify mix without diluting the Flower lead, using Pre-Roll as the entry lever to buffer volatility and support price architecture reshaped by a 25.23% year-over-year decrease.
Competitive Landscape
Lavi is ranked #11 in NV Flower in June 2026, down 5 positions from #6 in June 2025, with a 1-rank improvement from #12 in March 2026 but still 8 places below its peak of #3 in July 2025; in contrast, STIIIZY held #1 both in June 2026 and June 2025 while growing sales 5.17% year over year, and FloraVega / Welleaf jumped from #22 to #3 alongside a 260.35% sales increase, indicating that Lavi’s negative rank delta is tied to faster-moving incumbents and surging challengers rather than broad market contraction. The combination of a 1-rank quarter-over-quarter lift and a 5-position year-over-year slide implies a mid-pack stall: short-term stabilization without reclaiming the trajectory needed to contend with top-5 movers.

Notable Products
Orange Beltz (14g) set the tone with a -30.6% month-over-month slide while still holding rank 1, implying heavy reliance on a single Flower anchor even as volume retrenched by roughly a third. Double Diamond (14g) sat at rank 3 and Governmint Oasis (14g) at rank 10, placing three Flower SKUs inside the top ten while five Pre-Roll SKUs clustered between ranks 2 and 9, which signals a barbell mix where premium Flower drives the top rank but the middle of the board is increasingly Pre-Roll-heavy. With True OG Pre-Roll (1g) at rank 2 despite no reported month-over-month rate and total sales concentrated in one Flower SKU at approximately $60,463, the category split suggests Lavi is tilting toward breadth in Pre-Rolls while consolidating value in a shrinking but still lead Flower flagship. The pattern implies near-term commercial focus on protecting the flagship Flower position while expanding Pre-Roll penetration to stabilize rank dispersion.
Top Selling Cannabis Brands
Data for this report comes from real-time sales reporting by participating cannabis retailers via their point-of-sale systems, which are linked up with Headset’s business intelligence software. Headset’s data is very reliable, as it comes digitally direct from our partner retailers. However, the potential does exist for misreporting in the instance of duplicates, incorrectly classified products, inaccurate entry of products into point-of-sale systems, or even simple human error at the point of purchase. Thus, there is a slight margin of error to consider. Brands listed on this page are ranked in the top twenty within the market and product category by total retail sales volume.

