Market Insights Snapshot
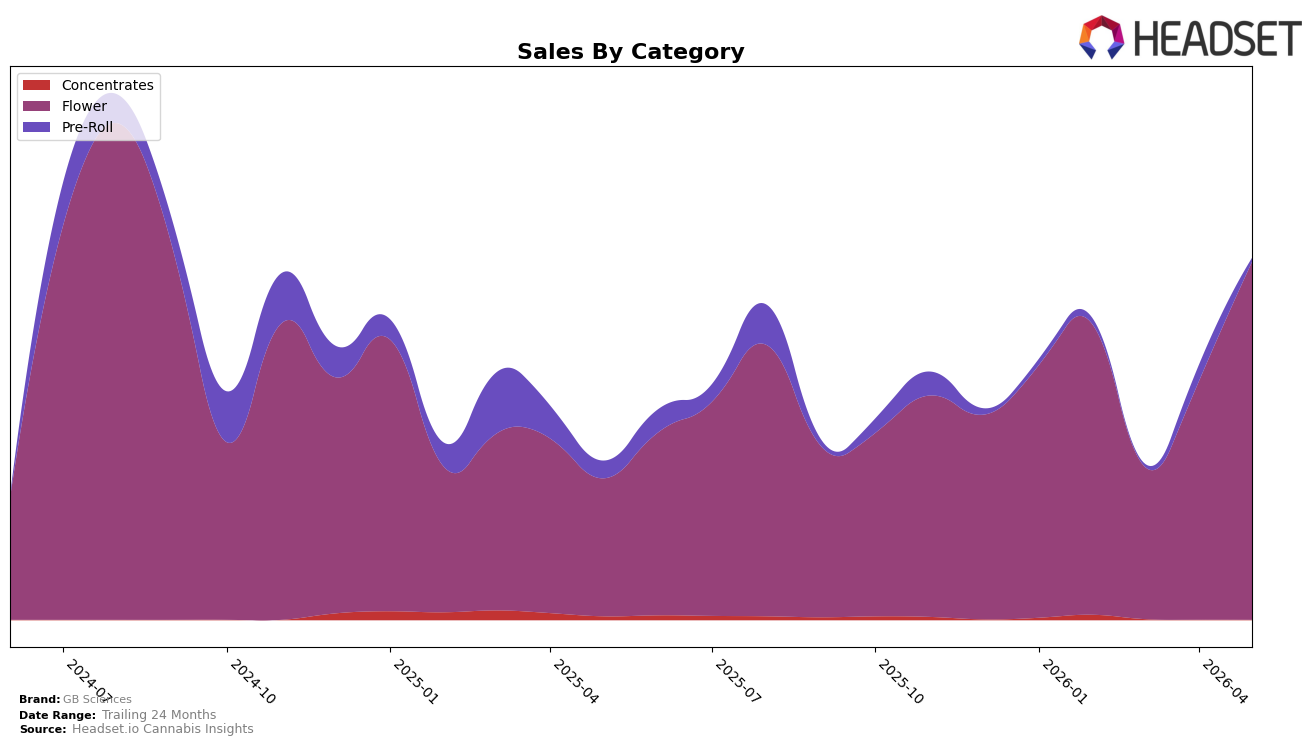
In May 2026, GB Sciences concentrated 99.00% category share in Flower with a 159.98% year-over-year sales increase and a 50.46% month-over-month rise, while Pre-Roll fell to 1.00% share with a -79.14% YoY decline and a -77.45% MoM drop. The average price rose 58.35% YoY to $35.83 as Flower pricing averaged 36.60, aligning with the brand’s 128.07% overall YoY sales growth and indicating that mix expansion in Flower rather than Pre-Roll drove volume and price gains. This pattern implies GB Sciences is consolidating around a single-category engine, trading off diversification for momentum within Flower.
GB Sciences held rank 15 in Flower in Nevada, with Flower’s 50.46% MoM growth outpacing the brand’s shrinking Pre-Roll presence at -77.45% MoM and its -79.14% YoY trajectory. The 201.36% 24-month brand expansion alongside a 58.35% YoY price lift and a 99.00% mix concentration indicates positioning as a price-accepting Flower specialist rather than a breadth player, suggesting future share gains hinge more on sustaining Flower velocity than on recovering Pre-Roll.
Competitive Landscape
GB Sciences sits at rank #15 in NV Flower in May 2026, a climb of 25 spots from #40 year over year and up 8 positions from #23 in February 2026, while still one notch shy of its #14 peak from August 2024; against that backdrop, STIIIZY held #1 year over year with a 2.3% sales decline and Redwood surged from #54 to #5 with a 917.6% YoY sales increase, indicating GB Sciences is gaining rank faster than top incumbents but slower than breakout risers, which implies its trajectory is driven by steady share capture rather than disruptive spikes.

Notable Products
Jenny Kush (14g) delivered the standout movement in May 2026 with a month-over-month surge of 37,248.3% to $142,297 and vaulted into rank 2, while Jenny Kush (3.5g) slipped 6.7% yet held rank 1; this juxtaposition implies rapid consumer migration toward larger pack sizes despite a modest dip in the flagship eighth. Jenny Kush Pre-Roll (1g) fell 77.5% and sits at rank 3, and two of the top three are Flower SKUs, indicating category concentration even as the single Pre-Roll retrenches. With rank 1 and rank 2 both anchored in Flower and showing opposite MoM directions of -6.7% and +37,248.3%, the pattern points to a portfolio tilt toward value-per-gram formats and fewer ancillary format bets.
Top Selling Cannabis Brands
Data for this report comes from real-time sales reporting by participating cannabis retailers via their point-of-sale systems, which are linked up with Headset’s business intelligence software. Headset’s data is very reliable, as it comes digitally direct from our partner retailers. However, the potential does exist for misreporting in the instance of duplicates, incorrectly classified products, inaccurate entry of products into point-of-sale systems, or even simple human error at the point of purchase. Thus, there is a slight margin of error to consider. Brands listed on this page are ranked in the top twenty within the market and product category by total retail sales volume.

