.svg)

Sep-2026
Sales
Trend
6-Month
Product Count
SKUs
Avg Price
YoY Sales Change
YoY Price Change


Where to Buy
BOLD is stocked at 19 licensed dispensaries across Arkansas, New Jersey, and 2 other states, 8 of them in Arkansas, with the deepest coverage in Alexander, Brinkley, Clinton, Little Rock, and Monticello. Search by ZIP code or city below to find the closest one, or filter by product type if you are after a specific format.
Market Insights Snapshot
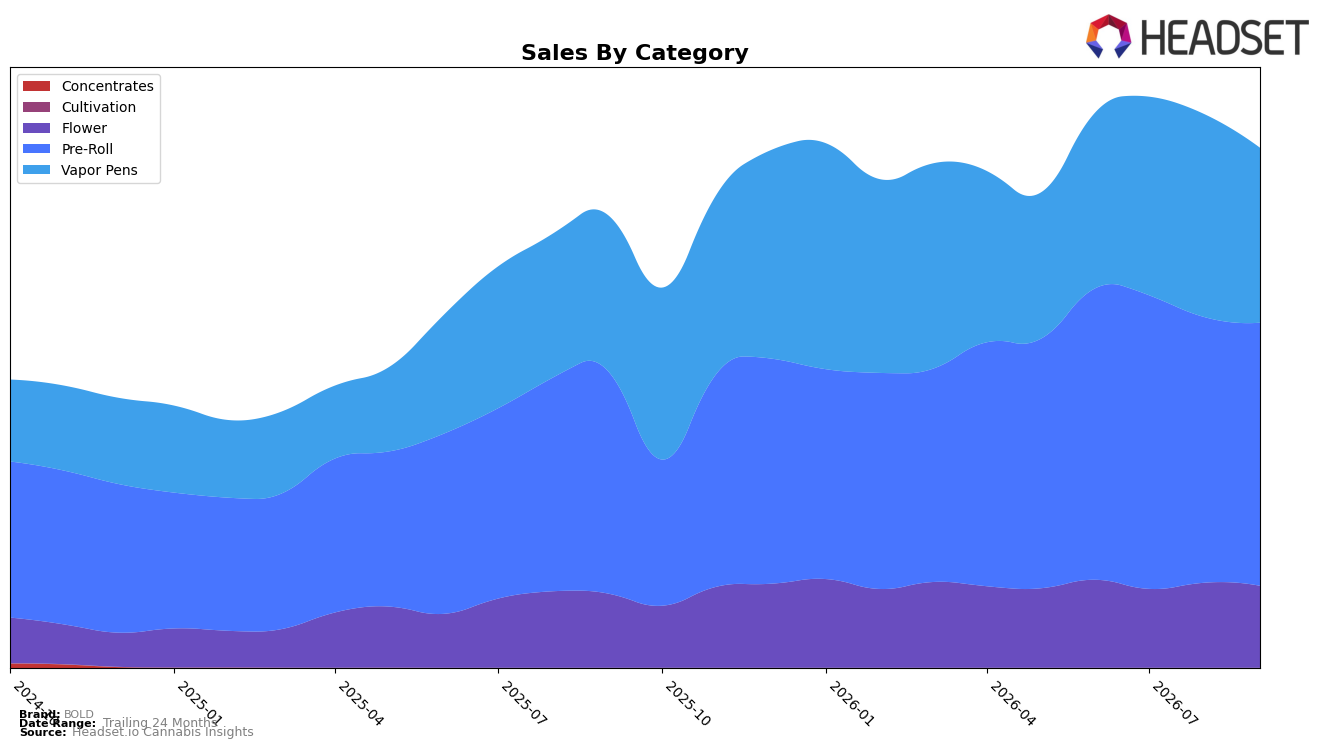
In September 2026, BOLD concentrated 50.62% of sales in Pre-Roll with year-over-year growth of 18.37% but a month-over-month dip of 0.94%, while Vapor Pens held 33.65% share with 12.12% year-over-year growth and a sharper 13.78% month-over-month decline. Flower accounted for 15.74% share, rising 10.61% year-over-year yet slipping 3.61% month-over-month, and the brand’s average price fell 6.99% year-over-year alongside total brand sales growth of 14.95% year-over-year. With the top state listed as Saskatchewan and Vapor Pens as the top category by competitive rank at position 2, the mix indicates BOLD is leaning on Pre-Roll for near-term volume stability while buffering category-specific volatility in Vapor Pens.
The combination of a 6.99% average price decline and category shares concentrated in Pre-Roll at 50.62% and Vapor Pens at 33.65% implies a value-tilted positioning that is driving unit throughput even as Vapor Pens softness pulls down month-over-month results by 13.78%. Holding rank 2 in Vapor Pens in Saskatchewan while Pre-Roll grows 18.37% year-over-year and Flower grows 10.61% year-over-year suggests BOLD’s pricing and assortment are calibrated to defend share in core inhalables, and the pattern points to prioritizing Pre-Roll-led acquisition with Vapor Pens acting as a higher-priced trade-up despite short-term month-over-month pressure.
Competitive Landscape
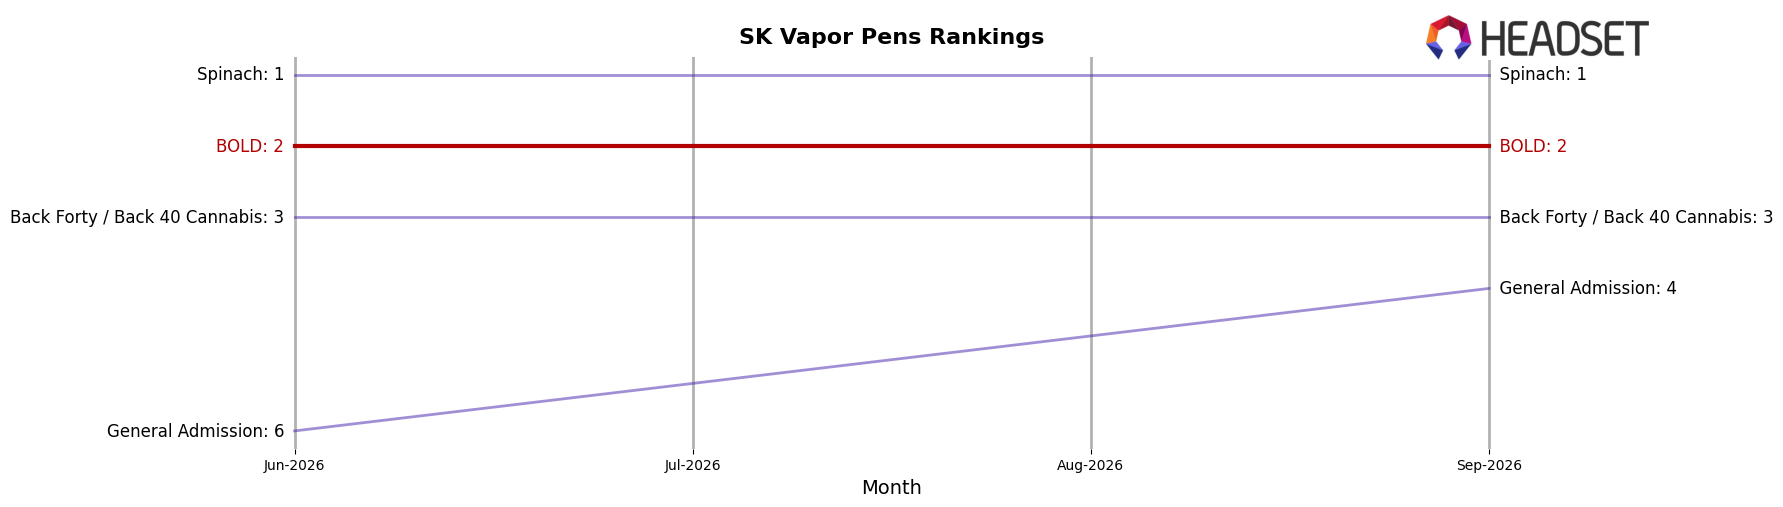
BOLD sits at rank #2 in SK Vapor Pens in September 2026 after a year-over-year slippage from #1, while its three-month position held at #2 and its peak of #1 came in March 2026; in contrast, Spinach is now #1 after moving up from #2 year over year with a 74.5% YoY sales increase, and General Admission advanced from #14 to #4 with 231.5% YoY growth, indicating competitive pressure from both the category leader and fast risers. With Back Forty / Back 40 Cannabis holding #3 year over year and currently at #3 despite 59.7% YoY growth, and Kolab climbing from #20 to #5 on 386.8% YoY growth, the pattern of BOLD’s drop from #1 to #2 alongside rivals’ double- to triple-digit gains implies BOLD must defend share against accelerating challengers to avoid further rank erosion.
Notable Products
Melted Strawberry Diamond Infused Pre-Roll 5-Pack (2g) posted the steepest move with a -22.38% month-over-month drop and slid to rank 3, while Cool Aid Kush Blunt (1g) also contracted -12.08% at rank 7, indicating pressure on infused and novelty formats. In contrast, Glazed Pre-Roll 2-Pack (2g) grew 12.72% MoM to hold rank 1 and Root Beer Float Blunt 3-Pack (1.5g) inched up 1.23% at rank 2, and eight of the top ten are Pre-Roll SKUs, concentrating share in one category despite mixed momentum. The new Root Beer Float Pre-Roll 10-Pack (5g) entered at rank 6 with $137,937 in September 2026 and Vapor Pens entries appeared at ranks 8 and 10 without MoM comps, signaling trial beyond Pre-Roll while the core still sets the pace. The pattern implies BOLD is leaning into value-forward multi-pack pre-rolls while pruning or repositioning underperforming infused variants to stabilize the category-led mix.
Top Selling Cannabis Brands






Data for this report comes from real-time sales reporting by participating cannabis retailers via their point-of-sale systems, which are linked up with Headset’s business intelligence software. Headset’s data is very reliable, as it comes digitally direct from our partner retailers. However, the potential does exist for misreporting in the instance of duplicates, incorrectly classified products, inaccurate entry of products into point-of-sale systems, or even simple human error at the point of purchase. Thus, there is a slight margin of error to consider. Brands listed on this page are ranked in the top twenty within the market and product category by total retail sales volume.

