Mar-2026
Sales
Trend
6-Month
Product Count
SKUs
Avg Price
YoY Sales Change
YoY Price Change
Market Insights Snapshot
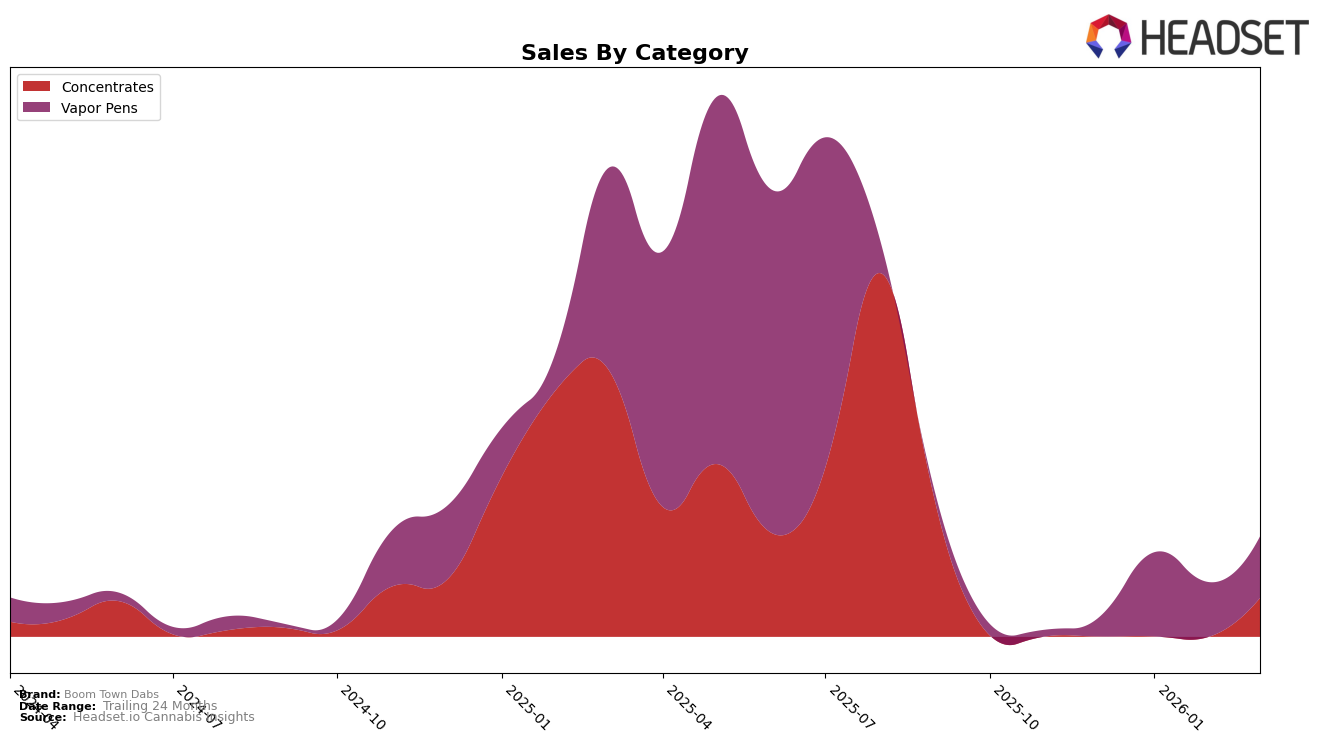
Boom Town Dabs has shown a noteworthy entrance into the Nevada market, particularly within the Concentrates category. In March 2026, they secured the 27th position, marking their debut in the top 30 brands for this category. This indicates a positive trajectory, as they were absent from the rankings in the preceding months. The move into the top 30 suggests a growing consumer interest and potential for further ascension in the coming months. The absence of rankings in December 2025, January 2026, and February 2026 highlights the recent nature of this achievement, which could be indicative of strategic adjustments or market penetration efforts.
In the Vapor Pens category, Boom Town Dabs has experienced some fluctuations in their rankings within Nevada. They were not in the top 30 in December 2025, but entered the rankings in January 2026 at 41st place, before moving to 48th in February and climbing slightly to 45th in March. This movement suggests a competitive landscape where Boom Town Dabs is striving to establish a foothold. Despite the challenges, their sales figures indicate a resilience and adaptability to consumer preferences, with a noticeable increase from February to March 2026. Such dynamics hint at the brand's ongoing efforts to optimize their product offerings and marketing strategies to capture a larger share of the market.
Competitive Landscape
In the competitive landscape of vapor pens in Nevada, Boom Town Dabs has experienced fluctuating rankings and sales, indicating a challenging market environment. Despite not being in the top 20 in December 2025, Boom Town Dabs entered the rankings at 41st in January 2026, only to drop to 48th in February and slightly recover to 45th in March. This volatility contrasts with competitors like LP Exotics, which maintained a stronger presence, ranking as high as 21st in January before dropping to 46th in March. Meanwhile, Fuze Extracts showed a downward trend, starting at 38th in January and falling to 48th by March, suggesting potential opportunities for Boom Town Dabs to capitalize on. Additionally, Mo-jo (NV) demonstrated a notable improvement, moving from 46th in January to 34th in February, before slipping to 42nd in March. These dynamics highlight the competitive pressures Boom Town Dabs faces, with its sales figures reflecting a downward trend from January to February, though showing a slight recovery in March, indicating a need for strategic adjustments to enhance market positioning.

Notable Products
In March 2026, the top-performing product for Boom Town Dabs was the Gush Mints Live Resin Cartridge (0.5g) in the Vapor Pens category, maintaining its first-place ranking from February with sales reaching 785 units. The Strawberry Runtz Live Resin Cartridge (1g) also performed well, ranking third, although it dropped from second place in the previous months. Notably, Old School Lemons Live Resin Sugar (1g) emerged in second place, marking its first appearance in the rankings. Meanwhile, the SinMintz Sunset Live Resin Cartridge (1g) experienced a decline, falling to fifth place from its previous top position in January. These shifts suggest a dynamic market where product popularity can change rapidly within the brand's offerings.
Top Selling Cannabis Brands
Data for this report comes from real-time sales reporting by participating cannabis retailers via their point-of-sale systems, which are linked up with Headset’s business intelligence software. Headset’s data is very reliable, as it comes digitally direct from our partner retailers. However, the potential does exist for misreporting in the instance of duplicates, incorrectly classified products, inaccurate entry of products into point-of-sale systems, or even simple human error at the point of purchase. Thus, there is a slight margin of error to consider. Brands listed on this page are ranked in the top twenty within the market and product category by total retail sales volume.

