Jun-2026
Sales
Trend
6-Month
Product Count
SKUs
Avg Price
YoY Sales Change
YoY Price Change
Market Insights Snapshot
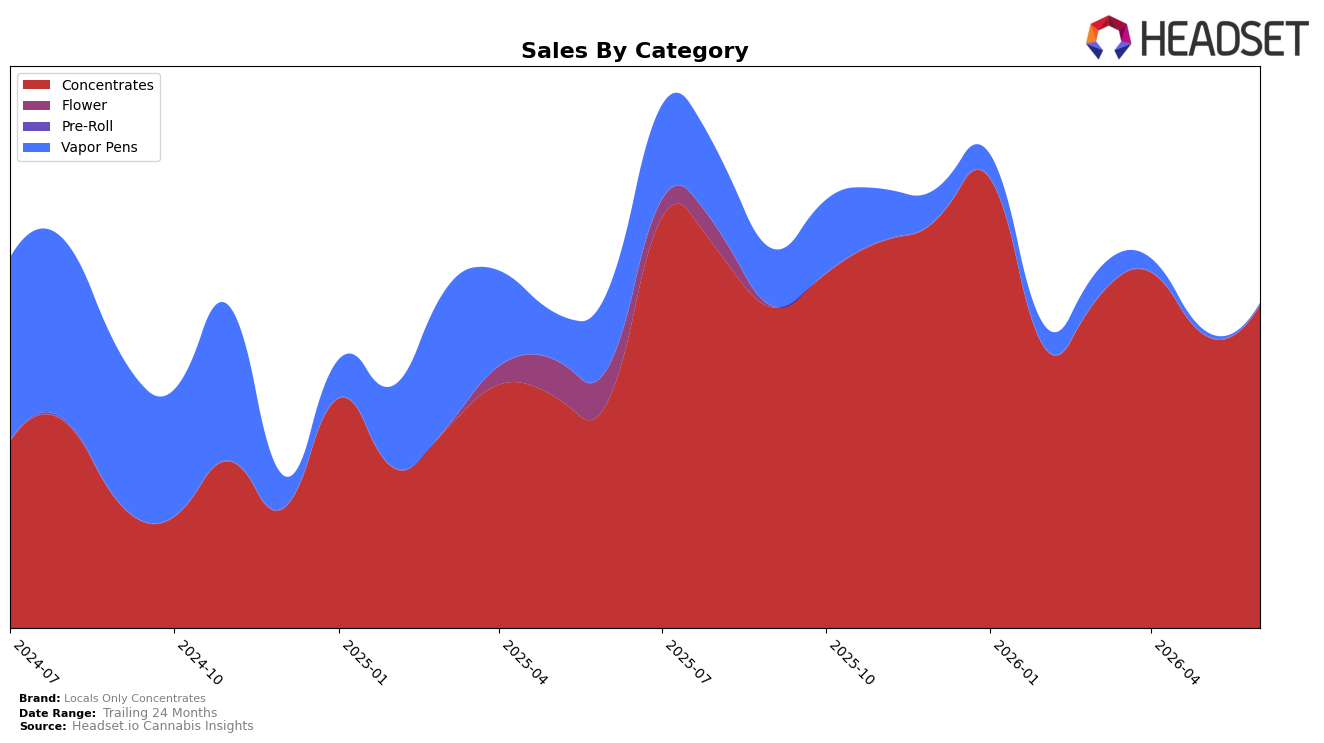
In June 2026, Locals Only Concentrates concentrated nearly all activity in Concentrates at 99.61% share with a 42.09% year-over-year increase and a 10.31% month-over-month lift, while Vapor Pens fell to 0.39% share with a -98.34% year-over-year decline and a -65.78% month-over-month drop. Despite a -3.86% brand-level year-over-year sales change and a 60.15% year-over-year rise in average price to $31.10, Concentrates volume and mix gains offset steep attrition in Vapor Pens. The pattern implies the brand is consolidating around a single-category core that is expanding faster than the overall brand trend, using price elevation and mix shift to counteract a shrinking secondary line.
With Concentrates holding rank 4 in New Jersey and reaching 99.61% of the mix, the brand’s positioning is that of a category specialist rather than a portfolio balancer, trading breadth for depth. The June 2026 month-over-month +10.31% in Concentrates alongside a -65.78% month-over-month collapse in Vapor Pens suggests resource allocation and consumer pull are reinforcing a single-lane strategy, which may sustain rank stability in core markets while constraining cross-category resilience. The implication is that future share defense will depend on maintaining double-digit Concentrates growth rates even as the -98.34% year-over-year decline in Vapor Pens limits diversification levers.
Competitive Landscape
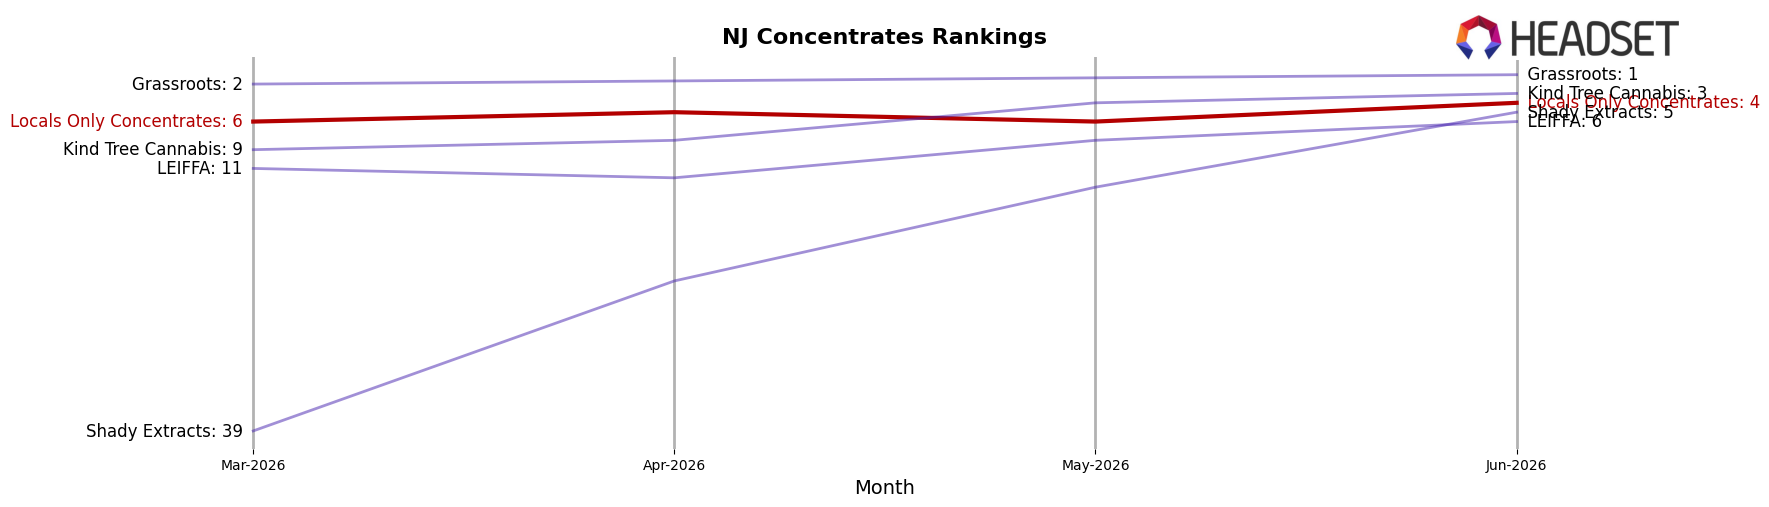
Locals Only Concentrates sits at rank #4 in New Jersey Concentrates in June 2026, improving 2 positions from #6 in March 2026, while hitting its peak rank of #4 in June 2026 and holding within the top 5 despite no reported year-over-year rank baseline. Competitive pressure is evident as Grassroots advanced from #2 to #1 and expanded sales by 23.9% year over year, and Kind Tree Cannabis slid from #4 to #3 with a 27.2% sales contraction, positioning Locals Only Concentrates directly behind a weakening incumbent while still trailing an accelerating leader. This pattern implies Locals Only Concentrates’ near-term rank trajectory depends on converting proximity to a declining #3 into share capture faster than leaders consolidate gains, with the #4 peak in June 2026 signaling immediate upside potential if momentum from the 2-rank climb is sustained.
Notable Products
Orange Push Pop Badder (1g) delivered the standout move in June 2026 with a +234.7% month-over-month surge that vaulted it to rank 1, while J1 Live Wet Diamonds (1g) fell 29.1% to rank 3. Diamond Bar Wet Diamonds (1g) declined 15.8% to rank 2 as Fig Bar Live Wet Diamonds (1g) rose 47.5% but held at rank 4, indicating share is rotating toward badder formats over wet diamonds despite mixed momentum across the top five. With four of the top ten coming from wet diamonds and two badders now occupying ranks 1 and 9, the product mix implies a pivot toward textures that can capture rapid upside while legacy wet diamonds face rank pressure.
Top Selling Cannabis Brands
Data for this report comes from real-time sales reporting by participating cannabis retailers via their point-of-sale systems, which are linked up with Headset’s business intelligence software. Headset’s data is very reliable, as it comes digitally direct from our partner retailers. However, the potential does exist for misreporting in the instance of duplicates, incorrectly classified products, inaccurate entry of products into point-of-sale systems, or even simple human error at the point of purchase. Thus, there is a slight margin of error to consider. Brands listed on this page are ranked in the top twenty within the market and product category by total retail sales volume.

