May-2026
Sales
Trend
6-Month
Product Count
SKUs
Avg Price
YoY Sales Change
YoY Price Change
Market Insights Snapshot
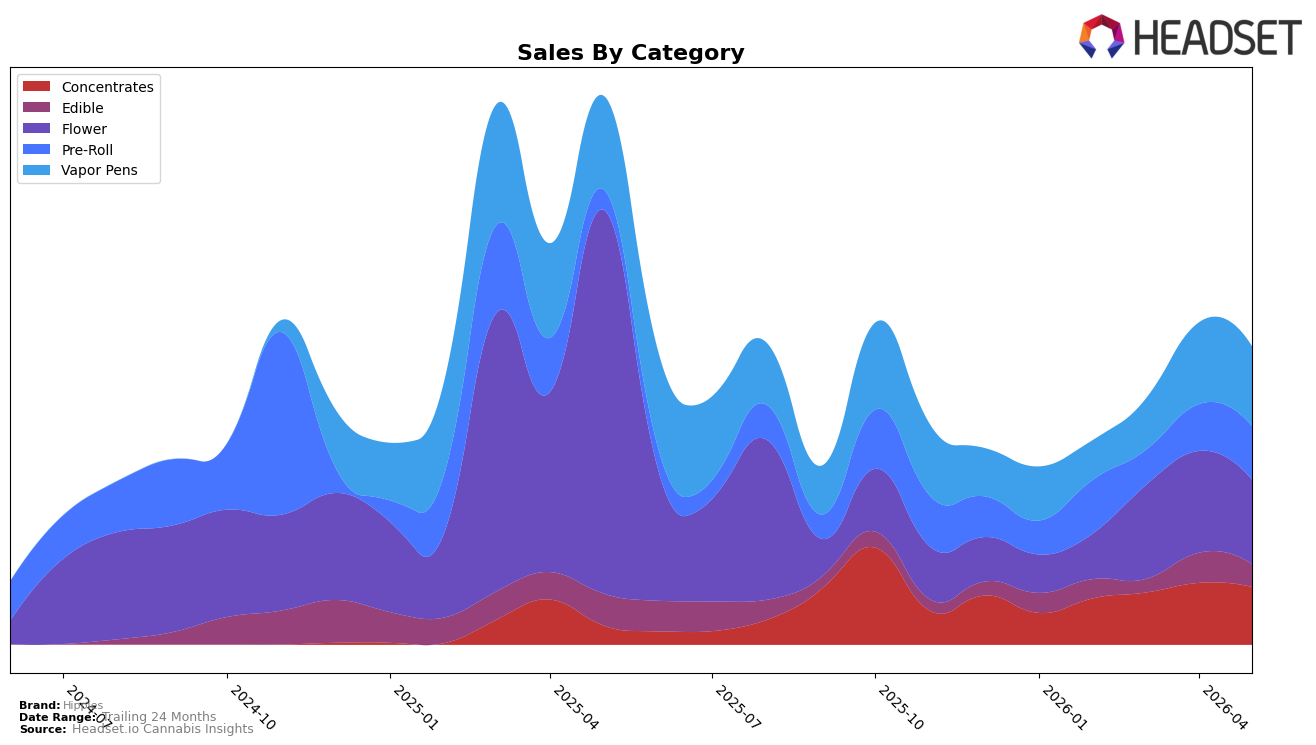
Hippies concentrated nearly half its May 2026 volume in Flower and Vapor Pens, but those anchors are retrenching: Flower held 28.33% share with a -78.06% year-over-year pullback and a -17.11% month-over-month slide, while Vapor Pens carried 26.79% share with -14.72% year-over-year and -2.27% month-over-month declines. Countering that, Pre-Roll expanded to 17.92% share on 163.50% year-over-year growth and a 14.65% month-over-month gain, and Concentrates moved to 19.41% share with 202.58% year-over-year growth despite a -6.51% month-over-month dip. Edible contracted to 7.55% share with -29.05% year-over-year and -24.53% month-over-month declines. With Flower ranked 46 in Nevada and the brand-wide average price down 45.56% year over year to $13.29, the mix indicates a pivot away from premium Flower into value-led, combustion and extract formats.
The shift toward Pre-Roll and Concentrates—adding a combined 183–366 percentage points of year-over-year momentum across those two categories while legacy anchors post double‑digit month-over-month declines—implies Hippies is trading depth in a lower-ranked Flower position for broader reach in faster-turn formats. The simultaneous 14.65% month-over-month gain in Pre-Roll alongside a -17.11% month-over-month slide in Flower signals basket substitution, and the -2.27% month-over-month softness in Vapor Pens paired with a -6.51% month-over-month dip in Concentrates points to price-sensitive switching under the 45.56% brand-wide price compression. Net, the pattern implies Hippies’ near-term positioning leans into accessible price points and convenience categories to offset rank pressure in Flower, with May 2026 mix resilience hinging on sustaining Pre-Roll velocity while stabilizing extract demand.
Competitive Landscape
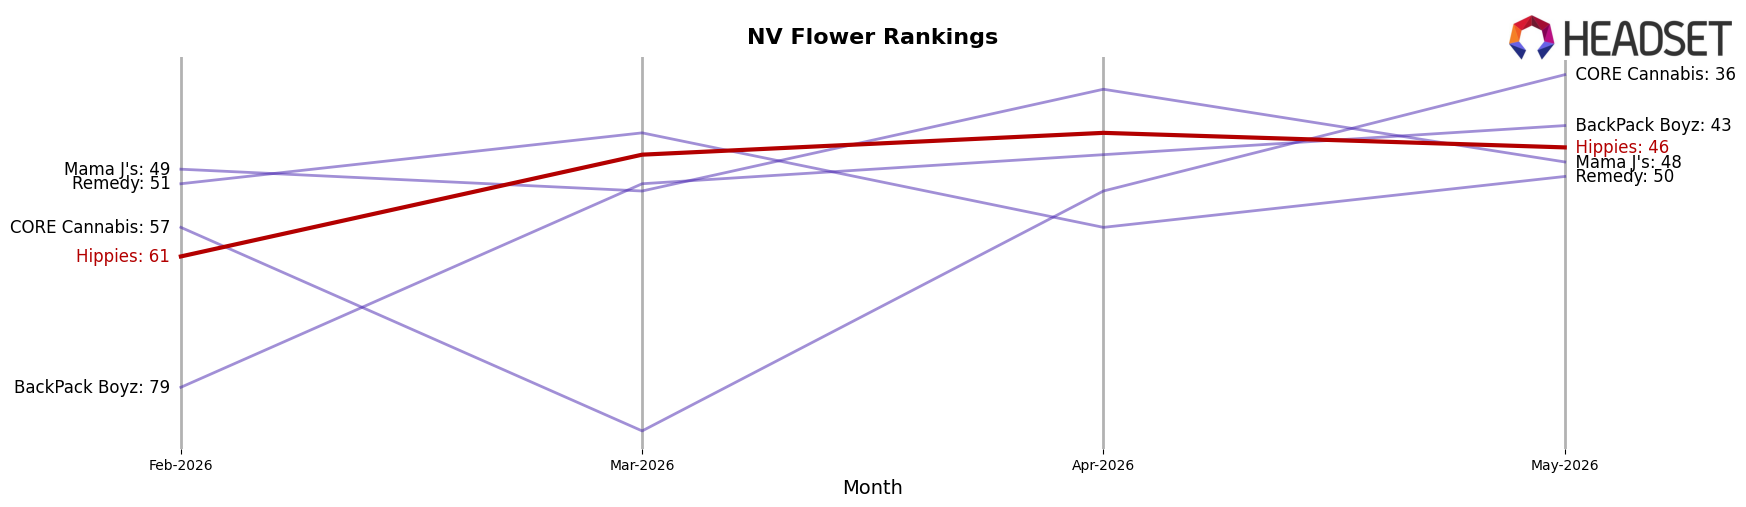
Hippies sits at rank #46 in May 2026 in NV Flower, down 32 positions year over year from #14, yet up 15 spots versus February 2026 from #61, indicating a partial rebound from a deeper dip. Meanwhile, STIIIZY held #1 both year over year and in May 2026 while posting a -2.3% YoY sales change, and Redwood surged from #54 to #5 with a 917.6% YoY sales increase, contrasting Hippies’ decline from a peak rank of #14 in May 2025 to #46 in May 2026. This trajectory implies Hippies is ceding long-term share despite a recent quarter-on-quarter lift, and the path back to relevance requires reversing the year-over-year rank erosion against faster-rising incumbents.
Notable Products
Ape S#!t (3.5g) posted the largest swing in May 2026 with a +99.6% month-over-month jump and climbed to rank 3, indicating that Flower can surge when tied to a leading strain name that also anchors Pre-Rolls. Garlic Cream Pre-Roll (1g) fell -56.2% MoM while sitting at rank 5, contrasting with Alien Rock Candy Pre-Roll (1g) up +18.9% at rank 2, which implies product-specific pull within a crowded Pre-Roll tier rather than a broad category lift. Three of the top five SKUs are Pre-Rolls, yet the single biggest mover is a Flower SKU, and the rank spread from 1 to 5 contains both a -56.2% drop and a +99.6% gain, pointing to a portfolio where strain branding outweighs format consistency. The mix suggests Hippies is pivoting toward strain-led laddering across formats, with Flower re-energizing the set while Pre-Rolls carry distribution breadth and Vapor Pens (ranks 6–9 with +5.1% and +1.6% movers) provide incremental, steadier velocity anchored by one mid-tier dollar contributor at $15,438.
Top Selling Cannabis Brands
Data for this report comes from real-time sales reporting by participating cannabis retailers via their point-of-sale systems, which are linked up with Headset’s business intelligence software. Headset’s data is very reliable, as it comes digitally direct from our partner retailers. However, the potential does exist for misreporting in the instance of duplicates, incorrectly classified products, inaccurate entry of products into point-of-sale systems, or even simple human error at the point of purchase. Thus, there is a slight margin of error to consider. Brands listed on this page are ranked in the top twenty within the market and product category by total retail sales volume.

