May-2026
Sales
Trend
6-Month
Product Count
SKUs
Avg Price
YoY Sales Change
YoY Price Change
Market Insights Snapshot
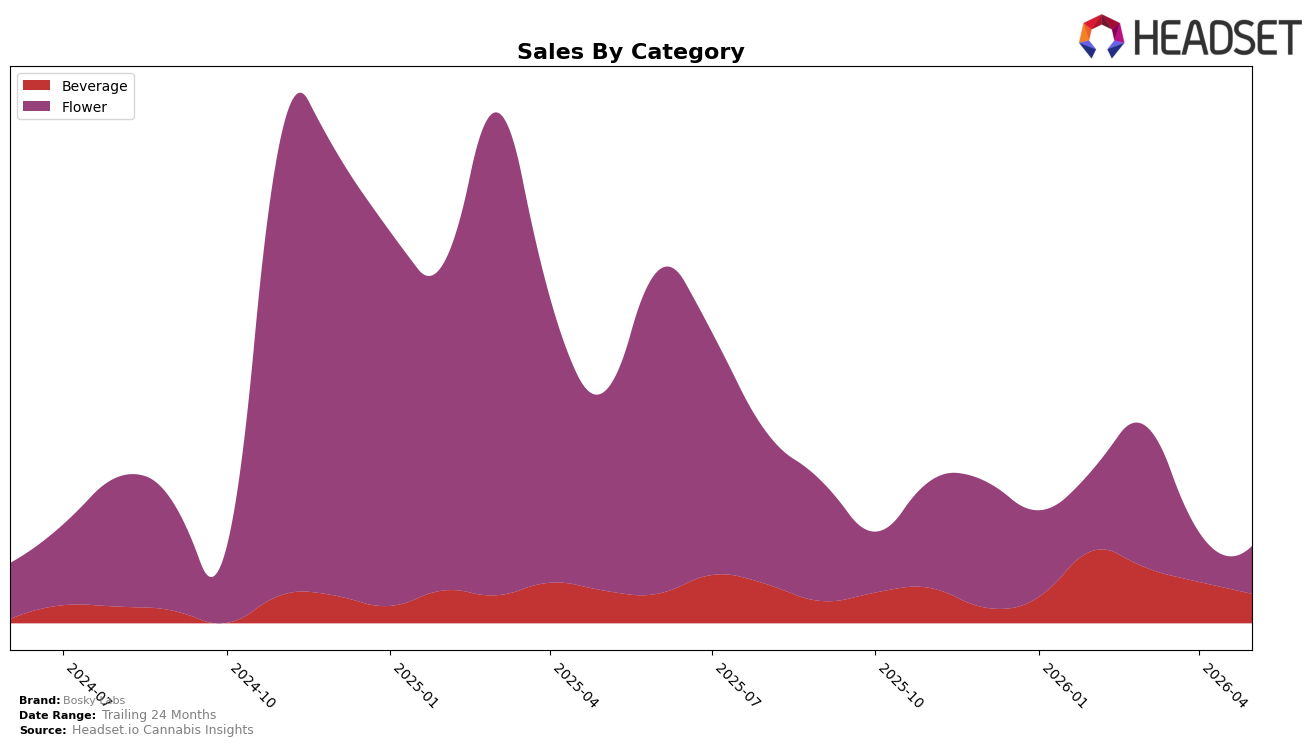
In May 2026, Bosky Labs concentrated in two categories with Flower at 60.49% share and Beverage at 39.51%, while Flower volume contracted with a -74.08% year-over-year decline and a -4.33% month-over-month dip, and Beverage softened by -8.69% year-over-year alongside a sharper -25.70% month-over-month pullback. The average price split of $43.58 in Flower versus $24.66 in Beverage coincided with a brand-level average price drop of -13.11% year-over-year, implying pricing pressure as mix tilts toward lower-priced units. With total brand sales falling -63.85% year-over-year against a 22.85% gain over 24 months, the near-term demand erosion is outpacing the longer-horizon base, implying that the current mix is amplifying volatility rather than cushioning it.
The May 2026 mix implies a positioning pinch: reliance on Flower at 60.49% share ties results to the category that fell -74.08% year-over-year, while Beverage’s -25.70% month-over-month drop curtails diversification benefits despite a relatively milder -8.69% year-over-year change. The lower Beverage price point at $24.66 versus $43.58 in Flower can support traffic as the brand average price declines -13.11% year-over-year, yet the -4.33% and -25.70% month-over-month moves signal that promotional or assortment levers are not offsetting demand swings. Net effect: the brand’s positioning skews toward price-sensitive pockets without sufficient counterweight from steadier categories, implying that price architecture and assortment need recalibration to reduce exposure to short-cycle shocks.
Competitive Landscape
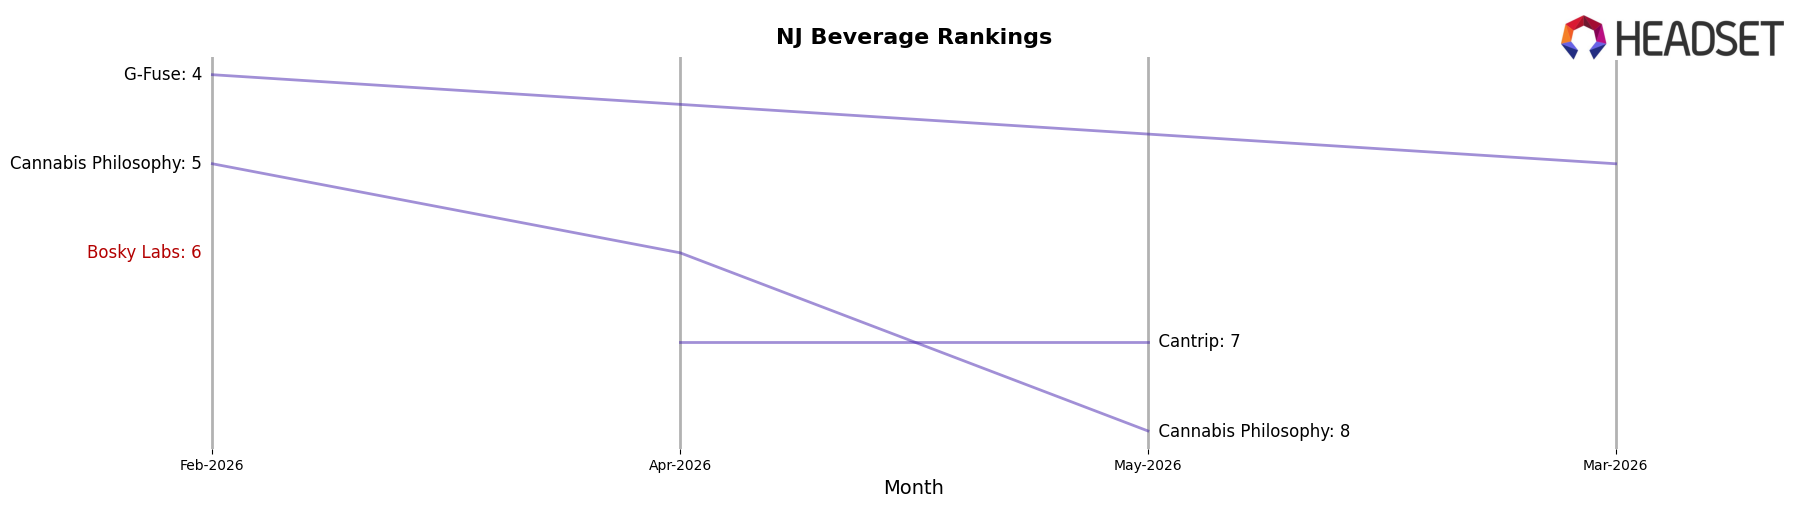
Bosky Labs sits at #10 in NJ Beverage for May 2026, down 5 places year over year and 4 spots from February 2026, after peaking at #3 in April 2025; by contrast, Journeyman climbed from #3 to #1 with a 530.4% YoY sales gain while Major holds #2 despite a 41.4% YoY sales decline, and Zero Proof moved from #1 to #5 alongside an 89.7% YoY sales drop. The slide from #6 three months ago to #10 now, coupled with a 7-rank gap to the category leader and a 2-rank buffer above the #12 threshold, implies Bosky Labs is ceding share to faster movers and needs a catalyst to avoid further rank erosion.
Notable Products
Blue Raspberry Hash Rosin Syrup (100mg) posted the largest movement in May 2026 with a 160.5% month-over-month gain and jumped to rank 2, while Strawberry Hash Rosin Syrup (100mg, 50ml, 1.7oz) fell 54.2% and sat at rank 7; this split within the Beverage line indicates concentrated demand around one hero SKU rather than broad flavor uptake. At the top of Flower, Point Break (3.5g) held rank 1 with a 24.5% lift as Z Pie (3.5g) climbed 56.5% to rank 5, yet Cherry Zeltzer (3.5g) dropped 50.4% to rank 6, signaling volatile preference sorting within the same category. With three Beverage SKUs in the top seven but two of them down more than 27% and 53.3% respectively, the category shows polarization even as one product scales; the pattern implies Bosky Labs is shifting toward a barbell mix of a flagship Beverage driver alongside select Flower leaders rather than evenly distributing velocity across flavors.
Top Selling Cannabis Brands
Data for this report comes from real-time sales reporting by participating cannabis retailers via their point-of-sale systems, which are linked up with Headset’s business intelligence software. Headset’s data is very reliable, as it comes digitally direct from our partner retailers. However, the potential does exist for misreporting in the instance of duplicates, incorrectly classified products, inaccurate entry of products into point-of-sale systems, or even simple human error at the point of purchase. Thus, there is a slight margin of error to consider. Brands listed on this page are ranked in the top twenty within the market and product category by total retail sales volume.

