Jun-2026
Sales
Trend
6-Month
Product Count
SKUs
Avg Price
YoY Sales Change
YoY Price Change
Market Insights Snapshot
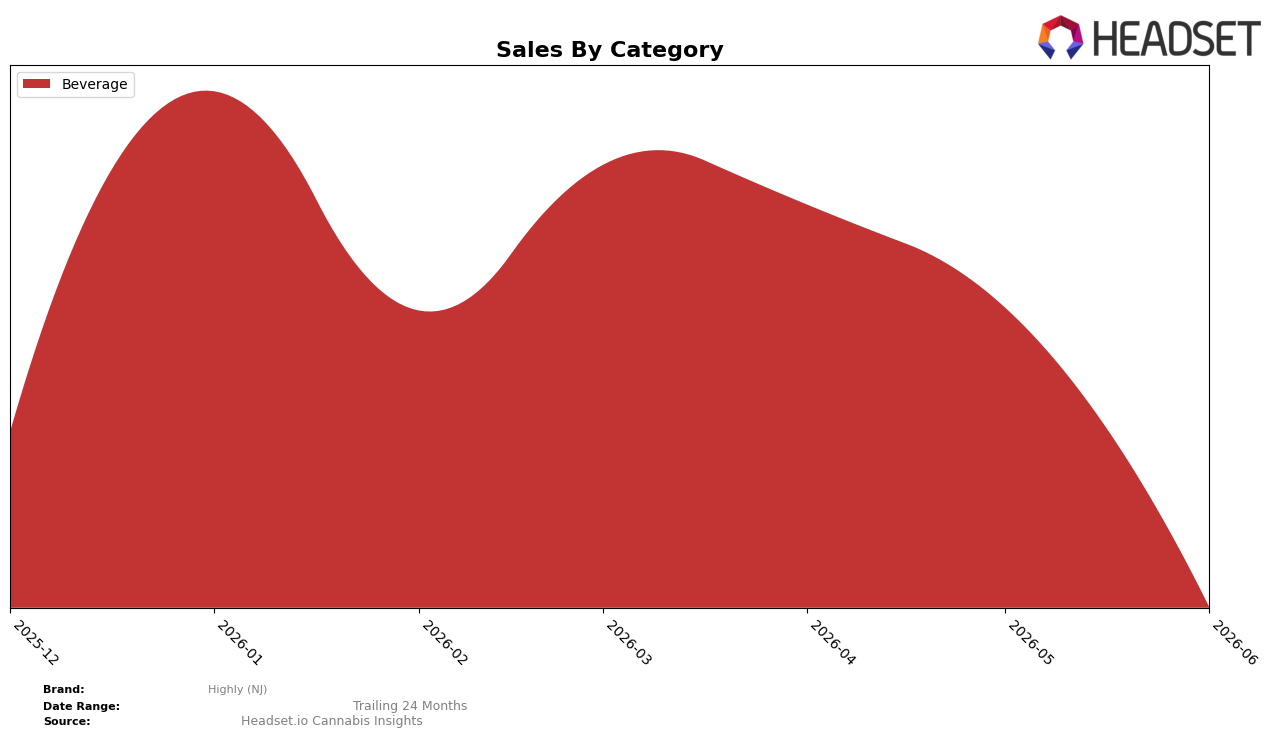
In June 2026, Highly (NJ) operated as a single-category brand with Beverage at 100.0% category share and a month-over-month decline of 49.79%, while year-over-year change is unavailable. The average price sat at $20.36 and, with no other categories contributing 0.0% share or rank movement to counterbalance, the mix concentrated entirely in Beverage. The pattern implies a narrow portfolio where a 49.79% month-over-month contraction in the only category amplifies volatility and signals reliance on a single demand stream without offset from adjacent categories.
Because Beverage holds 100.0% of sales and posted a 49.79% month-over-month drop in June 2026, Highly (NJ)’s positioning depends more on intra-category pricing and velocities than on cross-category cushioning. With rank data and year-over-year change unavailable but mix fixed at 100.0% Beverage, the brand’s exposure concentrates in one demand pocket, implying that any tactical move—pack sizes, flavor rotation, or promotional cadence—must recover nearly the entire 49.79% gap within Beverage rather than through diversification.
Competitive Landscape
Highly (NJ) sits at #5 in NJ Beverage in June 2026, down one position from #4 in March 2026 and two spots off its peak at #3 in February 2026, while Journeyman climbed to #1 from #2 year over year with 332.5% sales growth and Major slipped from #1 to #2 with an 11.2% sales decline; alongside Select moving up from #4 to #3 with 80.2% growth and Boho Euphorics holding #4 with no disclosed year-over-year figures, the mix of upward and downward moves implies Highly (NJ)’s rank trajectory is stabilizing mid-pack and will require share gains against faster-rising leaders to avoid further drift from its February 2026 peak.

Notable Products
Social - CBD/CBG/THC 1:1:1 Mango Lemonade Rosin Powder (100mg CBD, 100mg CBG, 100mg THC) posted the largest move in June 2026 with a +147.9% month-over-month surge to an estimated $1.47k, rising into rank 4 while Maple Nectar Rosin Powder 10-Pack (100mg) fell -34.0% but still held rank 1. Tangarine Chocolate Rosin Powder 10-Pack (100mg) declined -27.4% at rank 2, and Snoozy Rosin Powder 10-Pack (100mg) dropped -45.6% at rank 3, signaling a reshuffle where growth is concentrated in a functional, balanced-cannabinoid SKU rather than the legacy flavor-led 10-Packs. With four Beverage SKUs comprising the entire ranked set at positions 1 through 4, the lineup is consolidating around drinks even as volatility splits winners and laggards. The pattern implies Highly (NJ) is pivoting within Beverage toward effect-forward formulations, using the momentum of the 1:1:1 Mango Lemonade to offset declines in core flavor variants.
Top Selling Cannabis Brands
Data for this report comes from real-time sales reporting by participating cannabis retailers via their point-of-sale systems, which are linked up with Headset’s business intelligence software. Headset’s data is very reliable, as it comes digitally direct from our partner retailers. However, the potential does exist for misreporting in the instance of duplicates, incorrectly classified products, inaccurate entry of products into point-of-sale systems, or even simple human error at the point of purchase. Thus, there is a slight margin of error to consider. Brands listed on this page are ranked in the top twenty within the market and product category by total retail sales volume.

