May-2026
Sales
Trend
6-Month
Product Count
SKUs
Avg Price
YoY Sales Change
YoY Price Change
Market Insights Snapshot
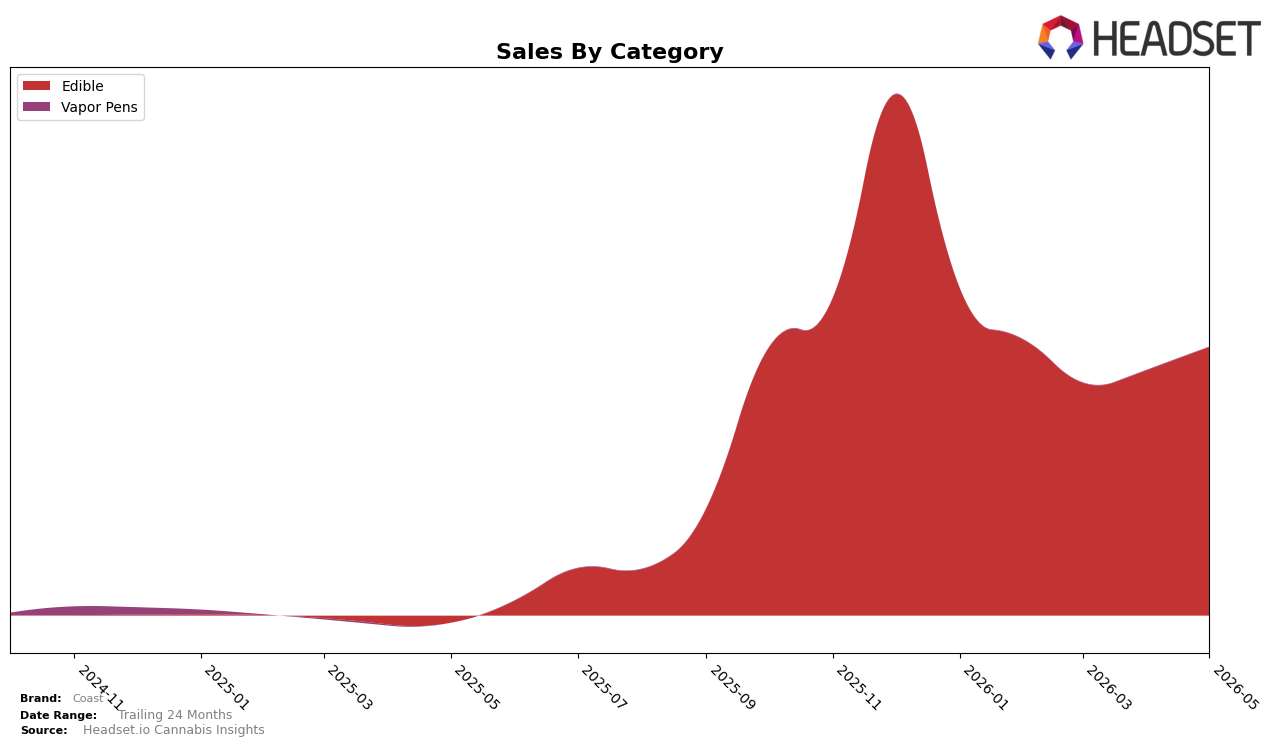
In May 2026, Coast operated as a single-category brand with Edible accounting for 100.0% of sales and a month-over-month change of 9.41%, while no year-over-year percentage was reported for Edible and no other categories contributed 0.00%. Within the Maryland Edible market, Coast held rank 27, and the average price sat at $20.03 alongside a 100.0% category mix concentration. The pattern implies Coast is consolidating around Edible in Maryland, using price stability near $20.03 and a mid-pack rank position at 27 to translate a 9.41% MoM uptick into depth rather than breadth.
The 100.0% reliance on Edible, coupled with a 9.41% MoM lift and a rank of 27, implies a positioning tuned to a focused buyer segment rather than portfolio-level share capture across multiple formats. With no year-over-year percentage in Edible and no secondary categories contributing 0.00%, Coast is trading diversification risk for clearer price-value signaling around $20.03 and aiming to convert incremental MoM gains into higher rank mobility from position 27 in Maryland.
Competitive Landscape
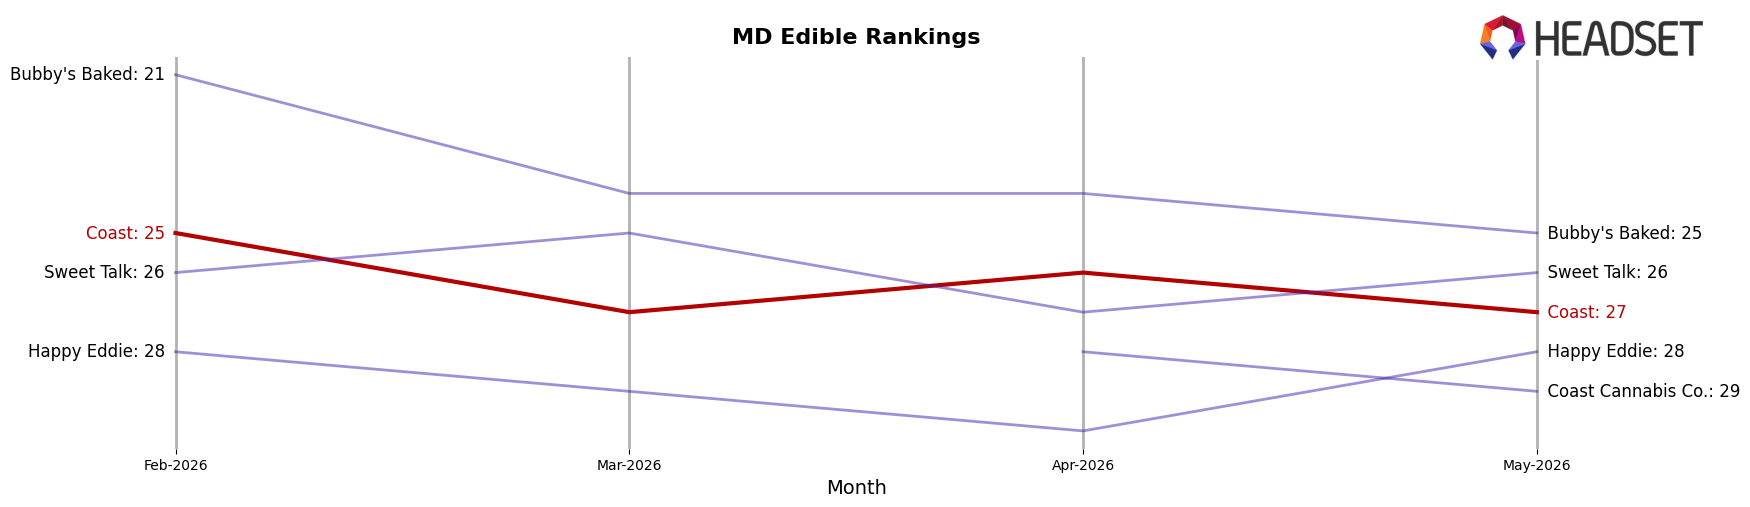
Coast sits at rank 27 in MD Edible in May 2026, down 2 places from rank 25 in February 2026, and 10 places below its peak at rank 17 in December 2025; without a reported year-over-year rank, the three-month slide and an 10-rank gap to peak frame the trajectory. Competitively, Incredibles holds rank 1 with a year-over-year rank of 2 and sales up 38.2%, while Betty's Eddies sits at rank 2 from a year-over-year rank of 1 with sales down 19.4%, indicating headroom for reshuffling at the top that has not translated to Coast’s tier; additionally, In House advanced to rank 4 from a year-over-year rank of 6 alongside 32.0% sales growth, outpacing Coast’s positional movement by at least 21 ranks. The pattern implies Coast is drifting toward the lower third of the leaderboard rather than consolidating mid-tier gains, so near-term share will likely hinge on reversing the rank decline observed since December 2025.
Notable Products
Nighttime - CBN/CBD/THC 1:1:1 Cranberry Pomegranate Gummies 20-Pack (100mg CBN, 100mg CBD, 100mg THC) posted the largest month-over-month surge at +87.4% and rose to rank 2, while the incumbent Nighttime - CBN/THC 5:1 Goodnight Grape Gummies 20-Pack (500mg CBN, 100mg THC) fell 18.1% yet held rank 1; this pivot within the top two points to demand shifting toward balanced formulations. THC/CBC/CBD 1:1:4 Boysenberry Gummies 20-Pack (100mg THC, 100mg CBC, 400mg CBD) advanced 78.0% into rank 4, as THC/CBN/CBC 1:1:1 Blissful Blueberry Gummies 20-Pack (100mg THC, 100mg CBN, 100mg CBC) contracted 30.5% at rank 6, and four of the top ten are Edible gummies with mixed minor-cannabinoid stacks; the single cited dollar figure is $20,133 for the top SKU, underscoring volume concentration at the summit. With additional gains of 61.9% at rank 9 and 25.1% at rank 5 alongside declines of 19.9% at rank 3 and 30.5% at rank 6, the dispersion signals a portfolio where balanced or CBD-forward blends are accumulating share at the expense of niche CBN or THCV-heavy options.
Top Selling Cannabis Brands
Data for this report comes from real-time sales reporting by participating cannabis retailers via their point-of-sale systems, which are linked up with Headset’s business intelligence software. Headset’s data is very reliable, as it comes digitally direct from our partner retailers. However, the potential does exist for misreporting in the instance of duplicates, incorrectly classified products, inaccurate entry of products into point-of-sale systems, or even simple human error at the point of purchase. Thus, there is a slight margin of error to consider. Brands listed on this page are ranked in the top twenty within the market and product category by total retail sales volume.

