Jun-2026
Sales
Trend
6-Month
Product Count
SKUs
Avg Price
YoY Sales Change
YoY Price Change
Market Insights Snapshot
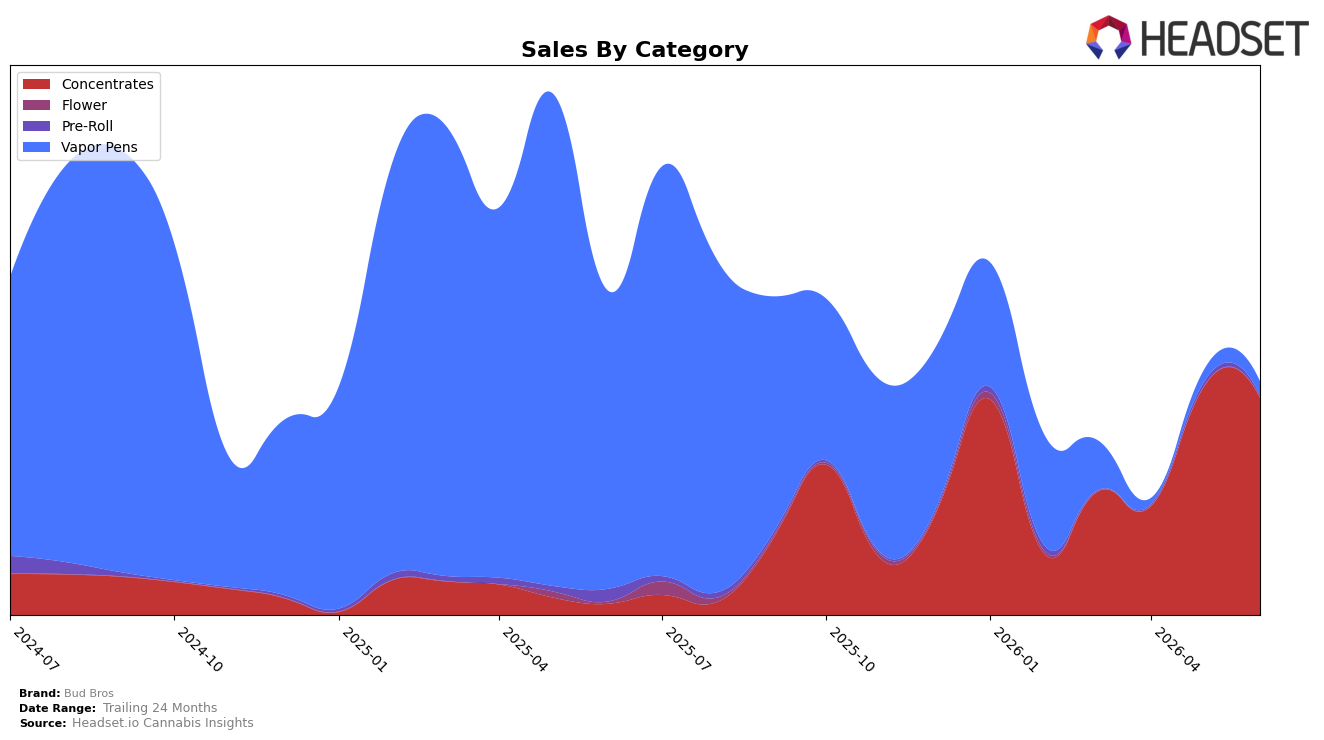
In June 2026, Bud Bros concentrated 93.40% of sales in Concentrates with a month-over-month decline of 5.35% yet an outlier year-over-year surge of 1,883.44%, while Vapor Pens held 5.75% share with a 12.87% MoM rise but a 95.51% YoY drop; Pre-Roll contributed 0.85% share with a 48.72% MoM decline and an 83.81% YoY decrease. Despite Concentrates being the top category, the Arizona Concentrates rank sat at 17, pointing to depth in one segment but mid-tier placement; the mix implies a pivot away from Vapor Pens and Pre-Roll toward Concentrates that lifted category share even as overall brand sales fell 28.00% YoY and average price contracted 66.62% YoY to $9.88.
The consolidation into Concentrates alongside a rank of 17 in Arizona suggests Bud Bros is competing primarily on volume and price within a single category, as evidenced by a 5.35% MoM dip in Concentrates against a 12.87% MoM uptick in Vapor Pens that remains too small at 5.75% share to change positioning. The combination of a 1,883.44% YoY spike in Concentrates and an 83.81% YoY fall in Pre-Roll indicates skewed momentum that likely compresses margins due to the 66.62% YoY average price decline, implying that sustaining share will depend on deepening penetration in Concentrates while selectively rebuilding a secondary category to buffer rank risk.
Competitive Landscape
Bud Bros sits at rank #17 in AZ Concentrates in June 2026, a 35-spot climb from #52 year over year, and an advance of 9 ranks from #26 in March 2026, marking its peak-to-date at #17 in June 2026. In contrast, Mohave Cannabis Co. held steady at #1 year over year while growing sales by 176.4%, and Drip Oils + Extracts moved up from #5 to #3 with a 32.5% sales lift, indicating that Bud Bros’ rank gains outpaced its near-term peers in positional movement but trail top-tier velocity. Meanwhile, Canamo stayed at #2 despite a 19.7% sales decline and WTF Extracts slipped from #3 to #5 with a 14.4% sales drop, suggesting Bud Bros is capitalizing more on competitor contraction than on absolute demand acceleration. The trajectory implies Bud Bros’ category ascent is driven by share reallocation rather than organic outperformance, positioning it as a mid-pack climber that must convert rank momentum into sustained share against #1–#3 incumbents.

Notable Products
Titan Express Applesauce (1g) posted the largest month-over-month swing in June 2026 with +175.1% growth and the number 1 rank, while Block Berry Badder (1g) fell -78.0% to rank 8. Astro GMO Applesauce (1g) rose +48.9% but held at rank 2, and Granddaddy Purp Applesauce (1g) declined -47.1% at rank 7, indicating sharp divergence within the same format. With nine of the top ten products in Concentrates and only one Vapor Pens SKU at rank 10, the mix concentrates revenue around extracts, with one standout SKU likely capturing wallet share from struggling badders and applesauces.
Top Selling Cannabis Brands
Data for this report comes from real-time sales reporting by participating cannabis retailers via their point-of-sale systems, which are linked up with Headset’s business intelligence software. Headset’s data is very reliable, as it comes digitally direct from our partner retailers. However, the potential does exist for misreporting in the instance of duplicates, incorrectly classified products, inaccurate entry of products into point-of-sale systems, or even simple human error at the point of purchase. Thus, there is a slight margin of error to consider. Brands listed on this page are ranked in the top twenty within the market and product category by total retail sales volume.

