.svg)


Market Insights Snapshot
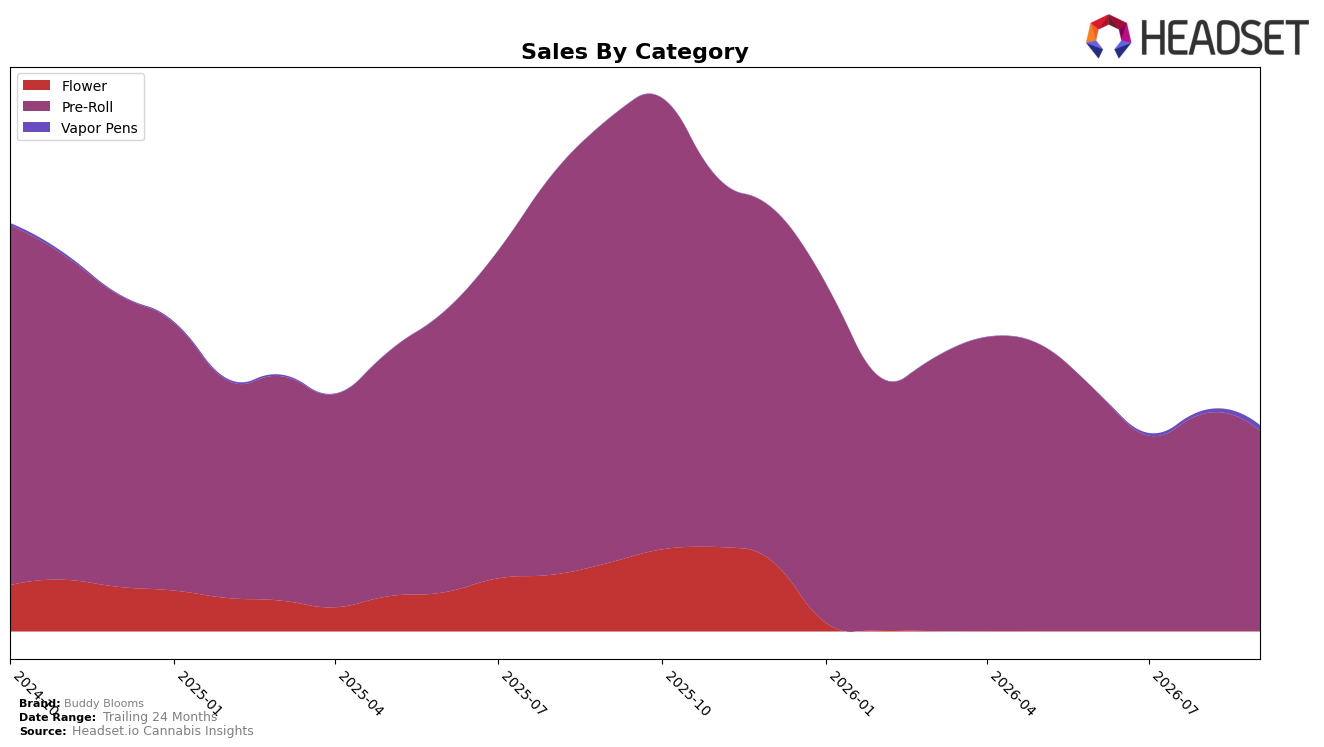
Buddy Blooms concentrated 97.30% of September 2026 sales in Pre-Roll, while Vapor Pens accounted for 2.70%, indicating a narrow category footprint alongside a brand-level year-over-year sales decline of 59.89% and a 24‑month decline of 46.72%. Within that mix, Pre-Roll sales fell 54.97% year over year and 8.08% month over month, while Vapor Pens grew 84.79% month over month from a small base; average price rose 17.00% year over year to $16.96, with Pre-Roll averaging 16.75 and Vapor Pens at 31.29. The combination of steep Pre-Roll contraction and rapid but small-base Vapor Pen growth implies overreliance on a shrinking core segment even as pricing moves up, increasing exposure to share loss if diversification does not accelerate.
Buddy Blooms ranked 39 in Pre-Roll in Ontario during September 2026 and held a 97.30% sales share in that category while experiencing an 8.08% month-over-month Pre-Roll decline and an 84.79% month-over-month uplift in Vapor Pens. With Pre-Roll down 54.97% year over year and Vapor Pens lacking a year-over-year baseline, the portfolio’s tilt and higher price point suggest positioning pressure at mid-shelf: trading up on price without a sufficiently scaled second category to offset rank risk in Ontario, implying a need to reframe assortment toward formats that can carry share when the lead category contracts.
Competitive Landscape
Buddy Blooms sits at rank #39 in ON Pre-Roll for September 2026, down 25 places year over year from #14, and 3 places lower than its June 2026 position at #36; its peak was #14 in September 2025, marking a 25-rank slide from peak to current. In contrast, Back Forty / Back 40 Cannabis moved from #2 to #1 while expanding sales by 46.6%, and Spinach climbed from #17 to #4 alongside a 141.2% sales lift, indicating that share is consolidating at the top as mid-pack brands lose rank. With General Admission slipping from #1 to #2 amid a 38.2% sales decline and Thumbs Up Brand advancing from #8 to #3 on 62.1% growth, Buddy Blooms’ movement from #14 to #39 implies a drift from contender tier to fringe consideration unless assortment or pricing resets reverse the rank erosion.

Notable Products
Big Buddy - Indica Pre-Roll 2-Pack (2g) posted the steepest decline at -29.4% and slid to rank 8, while Purple Haze Pre-Roll 10-Pack (5g) also fell -20.5% yet held rank 1. Biggest Buddy Sativa Pre-Roll 2-Pack (2g) dropped -11.0% at rank 2, contrasted by Purple Haze x Strawberry OG Pre-Roll 10-Pack (5g) rising +30.7% at rank 4 and contributing $72,168, indicating mix shift within the premium 10-pack tier. With all ten of the top ten being Pre-Roll SKUs and mid-size 2-packs underperforming versus 10-packs gaining or holding with +30.7% and +0.4% moves, the assortment is consolidating around larger-count formats rather than value 2-packs.
Top Selling Cannabis Brands






Data for this report comes from real-time sales reporting by participating cannabis retailers via their point-of-sale systems, which are linked up with Headset’s business intelligence software. Headset’s data is very reliable, as it comes digitally direct from our partner retailers. However, the potential does exist for misreporting in the instance of duplicates, incorrectly classified products, inaccurate entry of products into point-of-sale systems, or even simple human error at the point of purchase. Thus, there is a slight margin of error to consider. Brands listed on this page are ranked in the top twenty within the market and product category by total retail sales volume.

