.svg)


Market Insights Snapshot
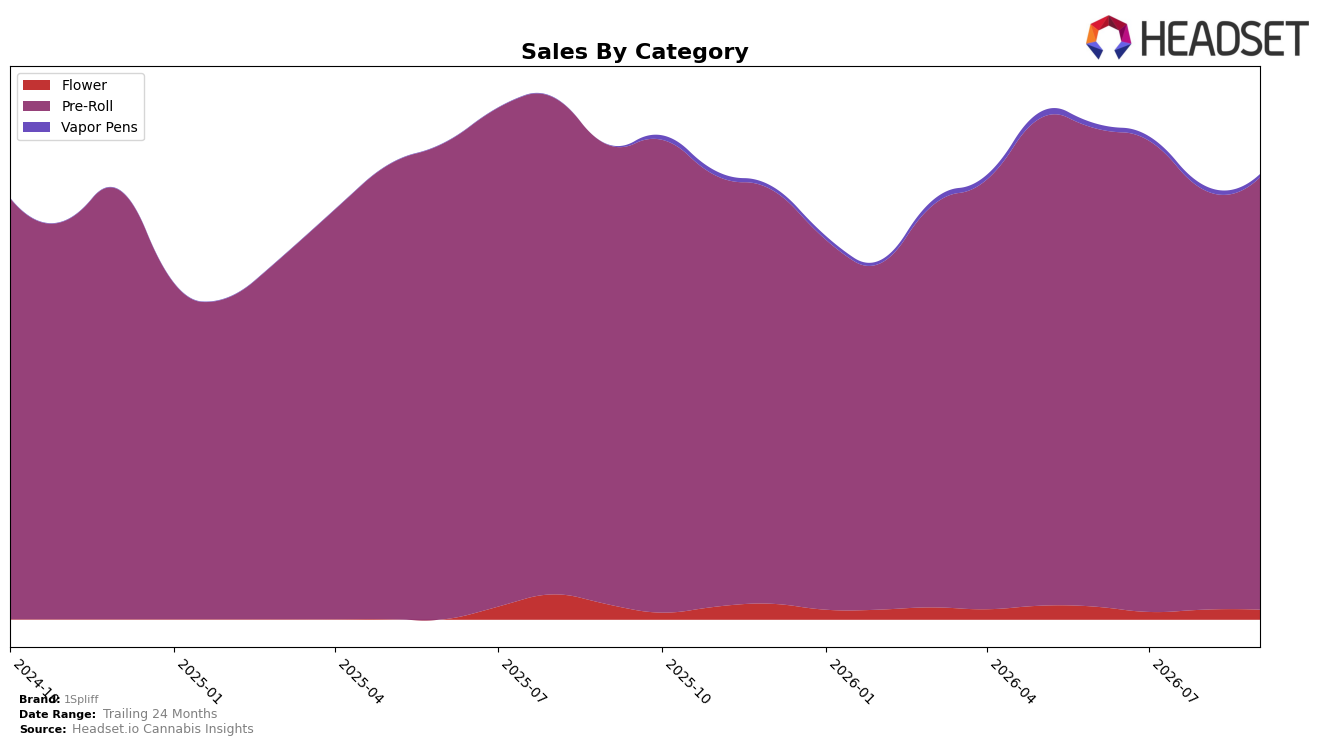
In September 2026, 1Spliff concentrated 97.20% of sales in Pre-Roll, where sales grew 3.08% month over month but fell 5.92% year over year, while Flower held 2.16% share with a 0.51% MoM decline and a 35.34% YoY contraction; Vapor Pens sat at 0.63% share with a 32.13% MoM drop and no prior-year baseline. The brand’s average price edged down 1.01% YoY to $19.73 as Pre-Roll pricing averaged 19.47, versus Flower at 37.84, and overall brand sales declined 6.25% YoY against a 12.93% gain over 24 months, implying a short-term pullback concentrated in a dominant Pre-Roll mix that still maintains volume resilience on a month-over-month basis.
With a 97.20% tilt to Pre-Roll and a category rank of 15 in Ontario, the 3.08% MoM gain in the core category alongside a 5.92% YoY dip signals a market share defense play hinging on incremental monthly recovery rather than broad diversification, while Flower’s 35.34% YoY slide and Vapor Pens’ 32.13% MoM drop limit cross-category insulation. The mix concentration and slight 1.01% YoY price reduction point to a value-accessible stance in Pre-Roll that can support rank stability in Ontario but leaves positioning sensitive to Pre-Roll demand cycles and susceptible to volatility from underperforming adjacencies.
Competitive Landscape
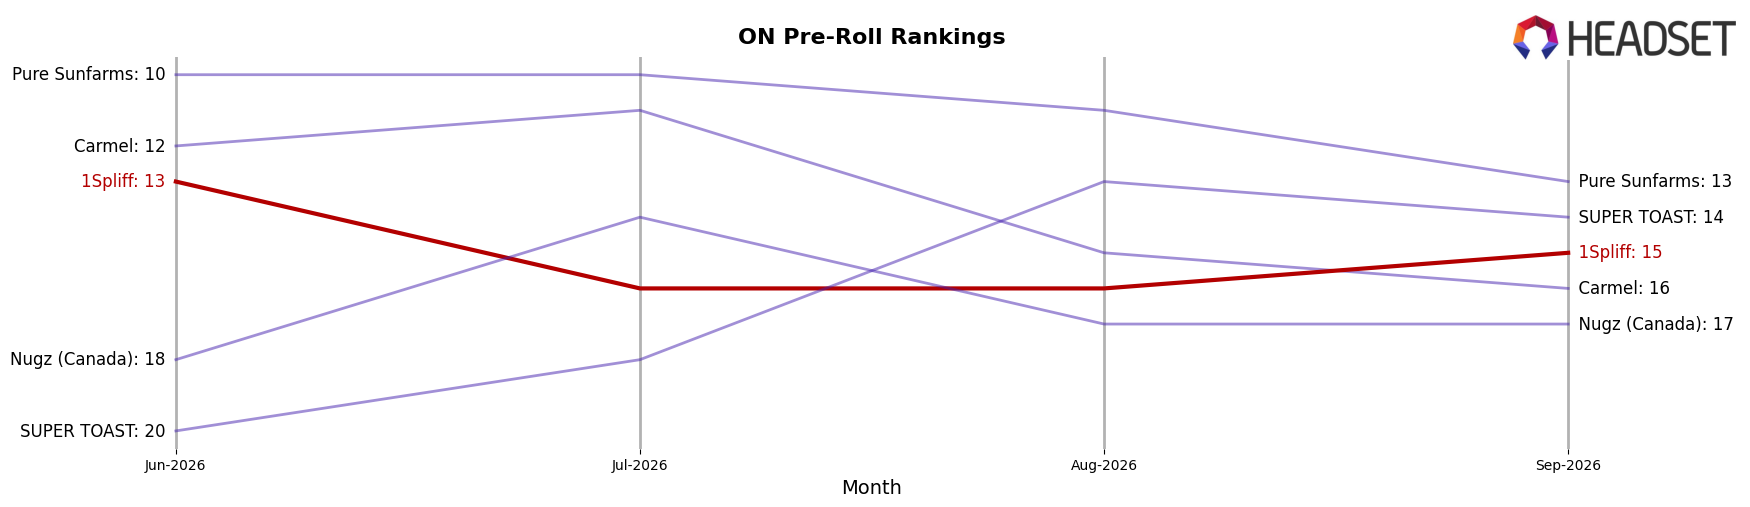
1Spliff sits at rank #15 in ON Pre-Roll for September 2026, a 1-place improvement from #16 in September 2025, but down 2 positions from #13 in June 2026 when it hit its peak; that three-month slide from #13 in June 2026 to #15 in September 2026 contrasts with Back Forty / Back 40 Cannabis holding #1 after rising from #2 year over year and General Admission slipping from #1 to #2 alongside a −38.21% YoY sales change. Meanwhile, Spinach climbed from #17 to #4 with a 141.21% YoY sales increase and Thumbs Up Brand advanced from #8 to #3 with a 62.07% YoY lift, tightening the top tier as 1Spliff’s two-rank retreat from its June 2026 peak implies that modest YoY rank gains are being outpaced by competitors consolidating share at a faster rate.
Notable Products
Grape Escape Pre-Roll 7-Pack (3.5g) posted the standout move in September 2026 with a +53.5% month-over-month surge and climbed to rank 2, while Pink Lemonade Pre-Roll 7-Pack (3.5g) slid -9.1% yet held rank 3. Cannon Pre-Roll (1g) remained rank 1 despite a -1.9% decline, and Hawaiian Snowcone Pre-Roll 7-Pack (3.5g) fell -15.6% at rank 6. With all ten top products in the Pre-Roll category and three multi-pack SKUs inside the top four, the mix points to deeper emphasis on value-oriented packs over single sticks.
Top Selling Cannabis Brands






Data for this report comes from real-time sales reporting by participating cannabis retailers via their point-of-sale systems, which are linked up with Headset’s business intelligence software. Headset’s data is very reliable, as it comes digitally direct from our partner retailers. However, the potential does exist for misreporting in the instance of duplicates, incorrectly classified products, inaccurate entry of products into point-of-sale systems, or even simple human error at the point of purchase. Thus, there is a slight margin of error to consider. Brands listed on this page are ranked in the top twenty within the market and product category by total retail sales volume.

