.svg)


Market Insights Snapshot
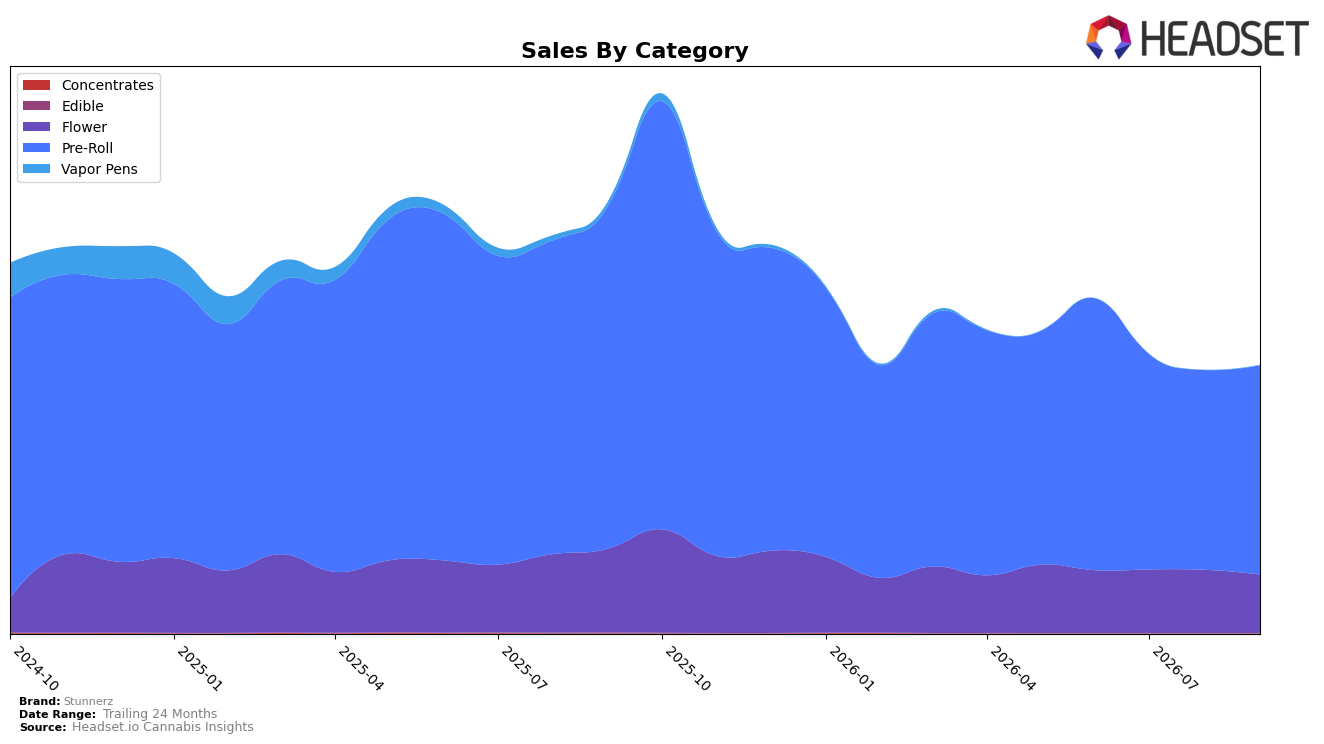
In September 2026, Stunnerz remained concentrated in Pre-Roll at 78.27% share while Flower held 21.73%, with Pre-Roll down 39.00% year over year and up 4.85% month over month, and Flower down 30.58% year over year and down 7.51% month over month; this mix sat against a brand-level year-over-year sales decline of 38.05% and a 0.18% rise in average price. Within the Ontario Pre-Roll context, rank at position 32 indicates mid-pack placement, and the intra-month divergence—Pre-Roll MoM growth versus Flower MoM contraction—implies the brand’s reliance on Pre-Roll is stabilizing short-term volume while Flower drag persists.
The tilt toward lower-priced Pre-Roll (average price 10.93) versus higher-priced Flower (average price 41.82), combined with a 4.85% MoM uptick in Pre-Roll against a 7.51% MoM decline in Flower and a brand average price up 0.18% YoY, signals a value-led positioning that prioritizes unit velocity over premium mix. Given a 39.00% YoY contraction in Pre-Roll alongside a relatively smaller 30.58% YoY decline in Flower and a Pre-Roll category rank of 32 in Ontario, the pattern implies near-term share defense through Pre-Roll promotions may be working month to month, but longer-term differentiation will depend on either lifting Flower penetration from 21.73% or improving Pre-Roll rank efficiency without further price compression.
Competitive Landscape
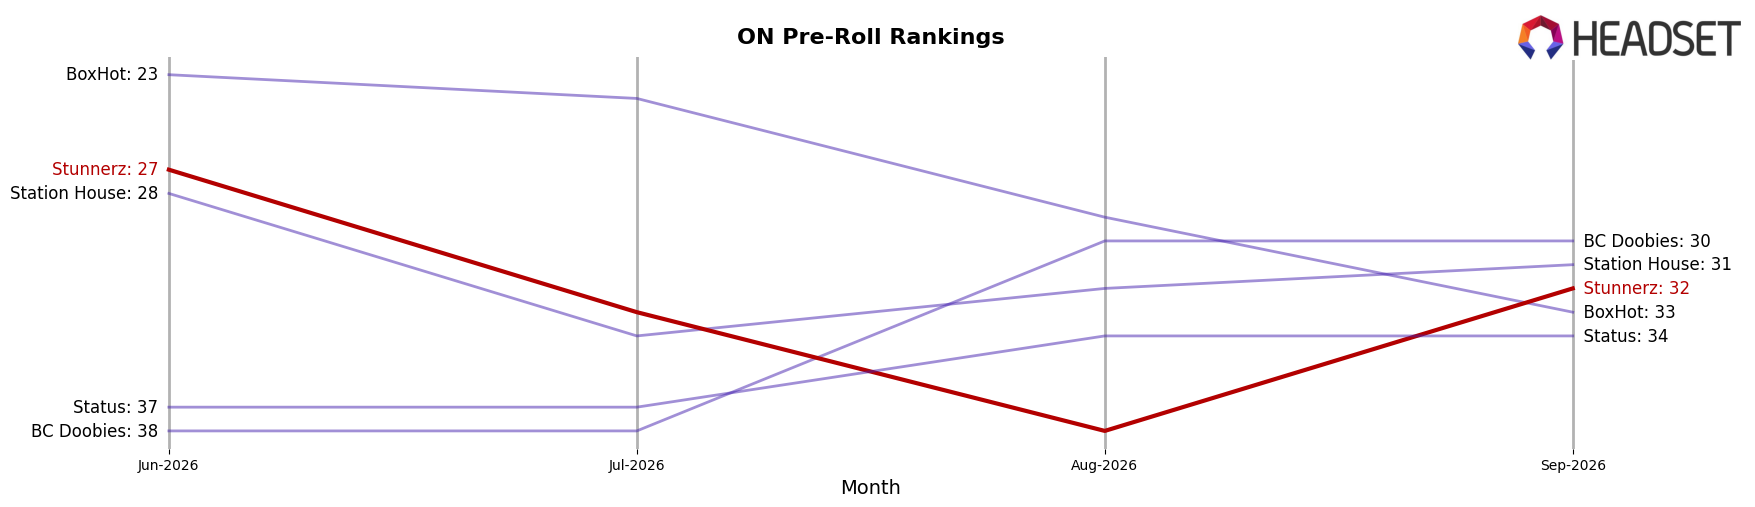
Stunnerz sits at rank #32 in ON Pre-Roll for September 2026, down 14 positions from #18 year over year and 5 positions from #27 in June 2026, while its historical peak was #14 in October 2025; in contrast, Back Forty / Back 40 Cannabis moved from #2 to #1 with 46.6% year-over-year sales growth and General Admission slipped from #1 to #2 alongside a 38.2% year-over-year sales decline; additionally, Spinach climbed from #17 to #4 with 141.2% year-over-year growth while Claybourne Co. edged down from #4 to #5 with a 21.8% decline, indicating that Stunnerz’s downward rank trajectory amid rapid ascents by value-forward rivals implies share is being redistributed toward brands with clearer momentum and pricing power.
Notable Products
Mangolorean Blitz Milled (3.5g) posted the steepest movement in September 2026 with a -66.1% month-over-month drop while holding rank 10, contrasting with Indica Bulk Pre-Roll 20-Pack (10g) at rank 5 rising 38.8% and Sativa Pre-Roll 2-Pack (2g) at rank 2 up 13.1%. Two of the top three ranks are Pre-Roll SKUs, and five of the top ten are Pre-Roll products, indicating a tilt toward ready-to-consume formats versus Flower, where Milled Variety Pack (14g) at rank 3 slipped -3.5%. The pattern implies Stunnerz is consolidating demand in core Pre-Roll formats while smaller flavor-led and Milled variants are ceding share, pointing product focus toward scalable, high-velocity packs over niche Flower lines.
Top Selling Cannabis Brands






Data for this report comes from real-time sales reporting by participating cannabis retailers via their point-of-sale systems, which are linked up with Headset’s business intelligence software. Headset’s data is very reliable, as it comes digitally direct from our partner retailers. However, the potential does exist for misreporting in the instance of duplicates, incorrectly classified products, inaccurate entry of products into point-of-sale systems, or even simple human error at the point of purchase. Thus, there is a slight margin of error to consider. Brands listed on this page are ranked in the top twenty within the market and product category by total retail sales volume.

