.svg)


Where to Buy
Burr's Place is stocked at 75 licensed dispensaries across California, with the deepest coverage in San Jose, Redding, Sacramento, Fresno, and Los Angeles. Search by ZIP code or city below to find the closest one, or filter by product type if you are after a specific format.
Market Insights Snapshot
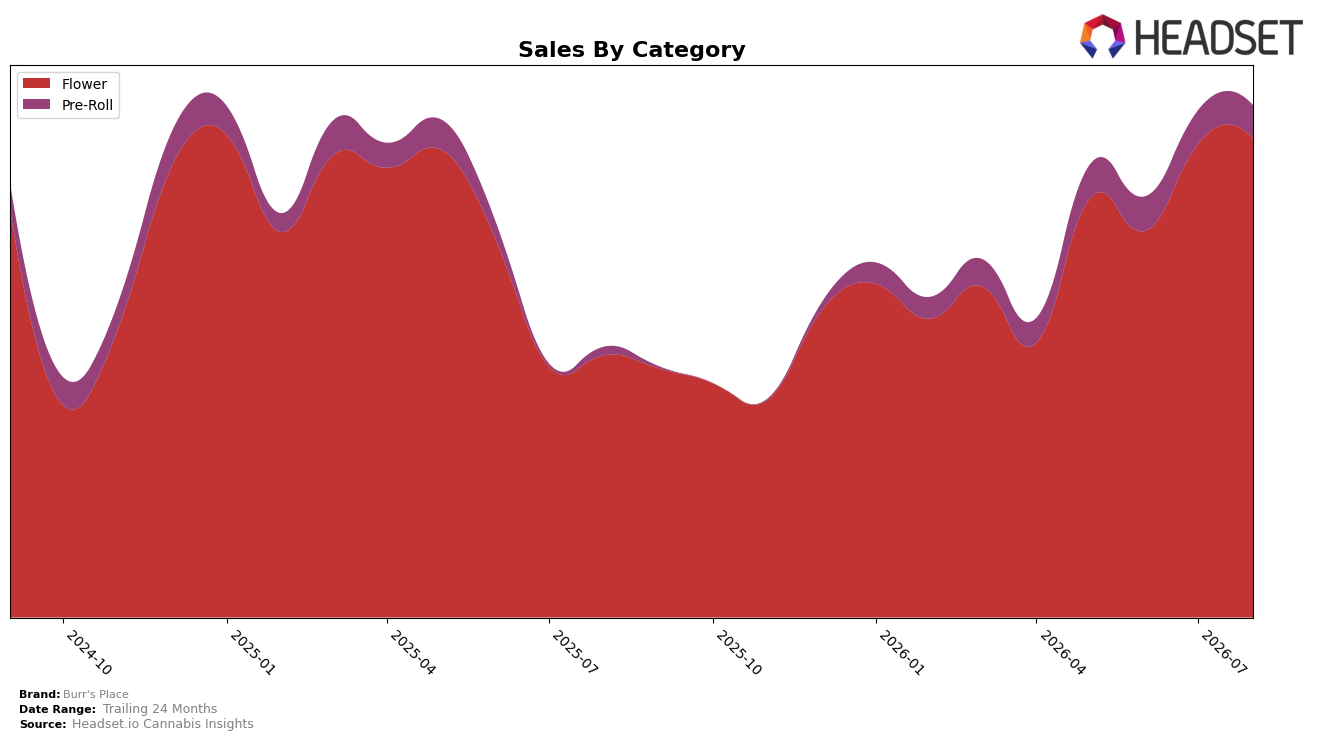
In August 2026, Burr's Place concentrated 93.31% of sales in Flower while Pre-Roll accounted for 6.69%, with Flower up 82.23% year over year and 1.02% month over month, versus Pre-Roll up 249.61% year over year but down 1.74% month over month. With overall brand sales up 88.26% year over year and average price up 1.58%, the slight month-over-month lift in Flower alongside a monthly dip in Pre-Roll signals that the brand’s growth engine remains anchored in Flower despite faster annual expansion in the smaller Pre-Roll slice; the pattern implies a scale-first posture where incremental share gains in Flower are prioritized over near-term volatility in Pre-Roll.
Positioning-wise, holding a 93.31% mix in Flower while ranking 30 in Flower in California suggests Burr's Place trades depth for breadth, using a narrow assortment to defend state-category rank while cautiously testing adjacencies that rose 249.61% year over year. The juxtaposition of a 1.02% month-over-month uptick in Flower and a 1.74% month-over-month decline in Pre-Roll implies the brand is optimizing for steady velocity and price realization in its core rather than accelerating assortment diversification; this supports a positioning thesis of category concentration aimed at reinforcing visibility within California Flower rather than dispersing resources across formats.
Competitive Landscape
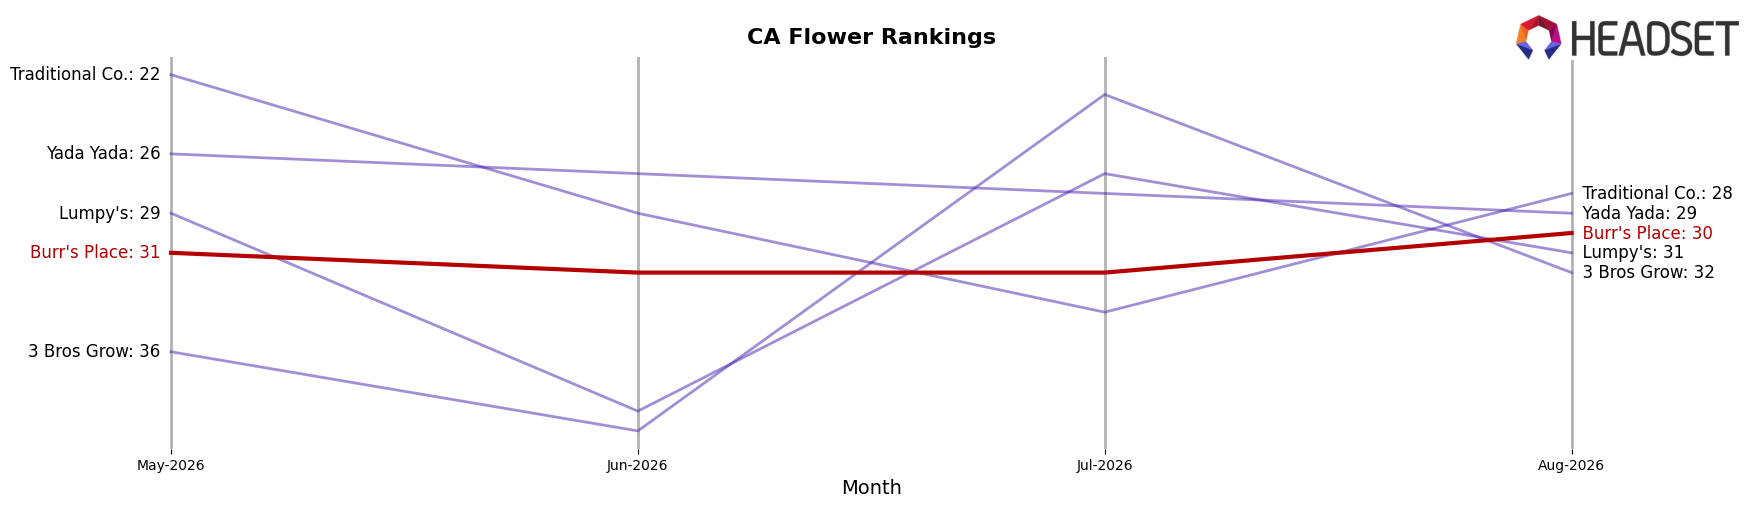
Burr's Place is ranked #30 in CA Flower in August 2026, improving 21 positions from #51 year over year and edging up 1 rank from #31 since May 2026; this coincides with its peak rank of #30 reached in August 2026. In the same period, STIIIZY advanced from #2 to #1 with a 51.0% YoY sales increase while CannaBiotix (CBX) fell from #1 to #3 with a 15.4% YoY sales decline, and Oakfruitland jumped from #14 to #5 alongside an 80.5% YoY gain; these shifts indicate Burr's Place is moving up but must outpace faster risers to convert rank stability into durable mid-tier share.
Notable Products
Zookie Doodles (3.5g) posted the steepest decline in August 2026, falling -40.0% MoM and slipping to rank 2 while Macaroon (3.5g) climbed 48.3% MoM to rank 1, indicating share consolidation at the top. Blueberry Biscotti (3.5g) advanced 41.9% MoM at rank 3, whereas Jelly Donutz #58 (3.5g) dropped -36.1% MoM to rank 8, and nine of the top ten are Flower SKUs, concentrating demand in a single category. Tropicana Shoes (3.5g) added 13.2% MoM at rank 4 while Splash (3.5g) in rank 9 grew 4.0% MoM, and the only notable dollar outlier was Splash at $20,900. The pattern implies Burr's Place is leaning into a narrow Flower-led lineup where momentum is rotating toward a few high-velocity 3.5g SKUs, increasing reliance on winners while exposing gaps when a core item contracts.
Top Selling Cannabis Brands






Data for this report comes from real-time sales reporting by participating cannabis retailers via their point-of-sale systems, which are linked up with Headset’s business intelligence software. Headset’s data is very reliable, as it comes digitally direct from our partner retailers. However, the potential does exist for misreporting in the instance of duplicates, incorrectly classified products, inaccurate entry of products into point-of-sale systems, or even simple human error at the point of purchase. Thus, there is a slight margin of error to consider. Brands listed on this page are ranked in the top twenty within the market and product category by total retail sales volume.

