.svg)

Sep-2026
Sales
Trend
6-Month
Product Count
SKUs
Avg Price
YoY Sales Change
YoY Price Change


Where to Buy
CAM is stocked at 516 licensed dispensaries across California, New York, and Illinois, 468 of them in California, with the deepest coverage in Los Angeles, Sacramento, San Diego, Santa Ana, and Costa Mesa. Search by ZIP code or city below to find the closest one, or filter by product type if you are after a specific format.
Market Insights Snapshot
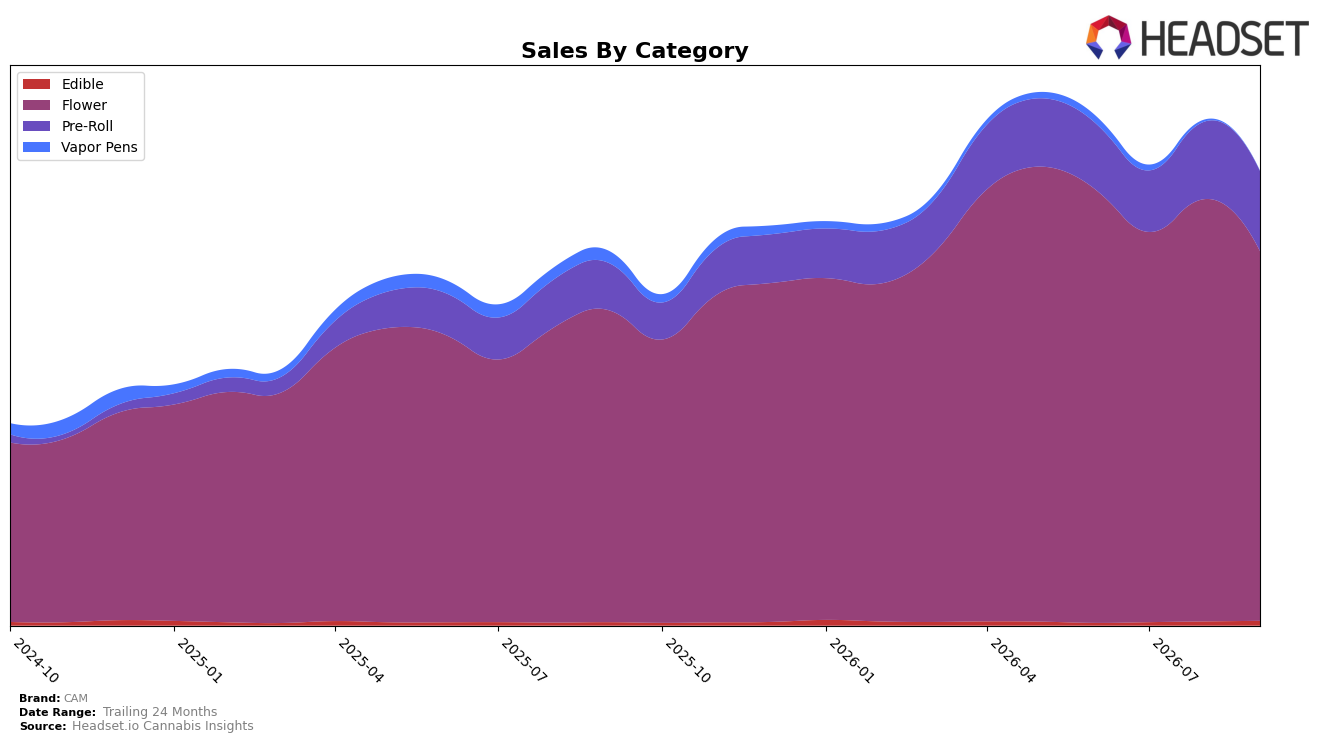
CAM’s mix in September 2026 is concentrated in Flower at 80.03% share with year-over-year growth of 18.32% but a month-over-month decline of 12.39%, while Pre-Roll holds 17.77% share with 65.80% YoY growth and a 3.27% MoM gain; smaller lines diverge, with Edible at 1.58% share up 22.24% YoY and 8.73% MoM, and Vapor Pens at 0.63% share plunging 80.21% YoY and 36.22% MoM. Despite brand-level sales up 20.76% YoY and average price down 18.19% YoY to $32.18, category-level signals are mixed: the Flower pullback MoM contrasts with Pre-Roll and Edible momentum, while Vapor Pens contracts sharply; the pattern implies the brand is trading volume toward combustibles while exiting or deprioritizing Vapor Pens.
Within California Flower, CAM sits at rank 2, and the 12.39% MoM decline in its majority Flower base alongside a 3.27% MoM lift in Pre-Roll signals a near-term rebalancing away from premium Flower reliance toward format diversification; the 65.80% YoY surge in Pre-Roll against an 18.32% YoY climb in Flower suggests share-of-growth is migrating to value-accessible formats. With Edible advancing 8.73% MoM and Vapor Pens down 36.22% MoM, the pricing reset alongside format shifts indicates the brand’s positioning is coalescing around inhalable formats led by Flower and reinforced by Pre-Roll, using lower realized prices to defend rank 2 while allowing Vapor Pens to contract.
Competitive Landscape
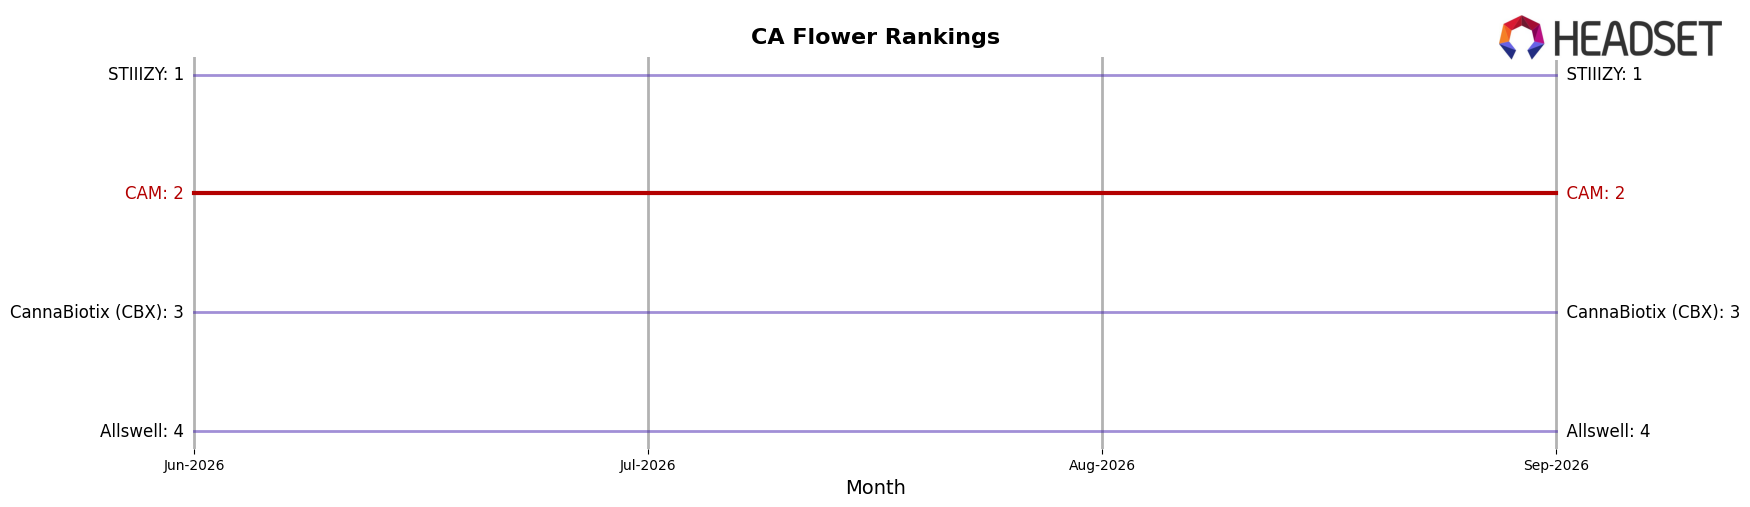
CAM sits at rank #2 in CA Flower in September 2026 after improving 1 position year over year from #3, while holding #2 over the last three months and previously peaking at #1 in May 2026; this places CAM directly behind STIIIZY at #1, which rose 1 spot YoY from #2 with a 47.8% sales increase, and ahead of CannaBiotix (CBX) at #3, which fell 2 spots from #1 alongside a 21.1% sales decline. Against the broader pack, CAM’s static three-month rank at #2 outpaces Allswell holding at #4 despite an 18.1% YoY lift, and maintains separation from Oakfruitland surging from #11 to #5 with 73.5% YoY growth; the combination of a 1-rank YoY climb and sustained #2 position implies CAM is anchored in a durable top-tier slot with line-of-sight contingent on displacing a faster-growing leader.
Notable Products
The steepest movement in September 2026 was Bubba's Girl Pre-Roll (1g) surging +164.5% MoM into rank 2, while Gelati Pre-Roll (1g) fell -26.0% to rank 5, creating a sharp bifurcation within the same format. Private Reserve - Bubba's Girl (3.5g) held rank 1 with +11.1% MoM and approximately $305,946 in sales, as Private Reserve - Coconut Milk (3.5g) slipped -9.6% to rank 3, indicating that momentum consolidated around the Bubba lineage across both Flower and Pre-Roll. Four of the top ten are Pre-Roll SKUs, and two of the top three are Flower, a split that points to CAM leaning into a two-track mix where high-velocity Pre-Rolls drive trial while flagship Flower sustains rank leadership.
Top Selling Cannabis Brands






Data for this report comes from real-time sales reporting by participating cannabis retailers via their point-of-sale systems, which are linked up with Headset’s business intelligence software. Headset’s data is very reliable, as it comes digitally direct from our partner retailers. However, the potential does exist for misreporting in the instance of duplicates, incorrectly classified products, inaccurate entry of products into point-of-sale systems, or even simple human error at the point of purchase. Thus, there is a slight margin of error to consider. Brands listed on this page are ranked in the top twenty within the market and product category by total retail sales volume.

