May-2026
Sales
Trend
6-Month
Product Count
SKUs
Avg Price
YoY Sales Change
YoY Price Change
Market Insights Snapshot
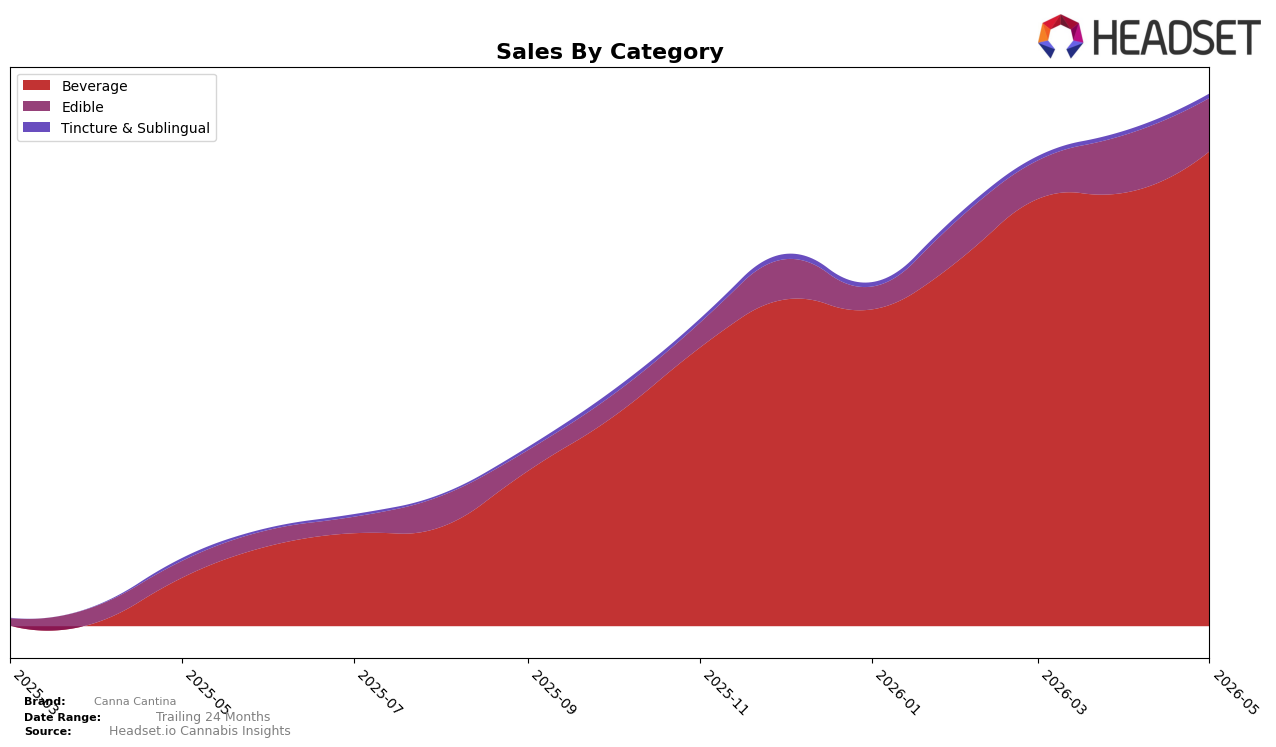
In May 2026, Canna Cantina derived 89.27% of sales from Beverage with year-over-year growth of 891.47% and month-over-month growth of 9.52%, while Edible held 9.97% share with 222.85% YoY and a -7.71% MoM decline; Tincture & Sublingual remained a 0.76% niche with 65.05% YoY and 6.31% MoM growth. Average price rose 31.97% YoY to $8.68 as Beverage pricing sat higher at $8.88 and Edible lower at $7.75, indicating mix uplift tied to the category with the highest velocity. The pattern implies that momentum is concentrated in Beverage, with MoM softness in Edible limiting diversification and leaving the portfolio reliant on a single category for share gains.
Within Beverage, Canna Cantina held a rank of 2 in Missouri, and the brand’s 9.52% MoM growth in its dominant category outpaced the -7.71% MoM movement in Edible, while the 65.05% YoY growth in Tincture & Sublingual did not offset its 0.76% share. The 891.47% YoY surge in Beverage alongside a 222.85% YoY rise in Edible concentrates the brand’s gains where it already leads, and the 31.97% YoY increase in average price suggests pricing power is being exercised primarily in Beverage rather than Edible. This implies positioning as a Beverage-led player in Missouri where price and rank are reinforcing each other, while lagging Edible momentum signals limited cross-category defensiveness if Beverage growth normalizes.
Competitive Landscape
Canna Cantina sits at #2 in MO Beverage in May 2026, with no published year-over-year rank change, and it has held #2 since March 2026 while also matching its peak rank of #2 in May 2026; by contrast, Keef Cola is #1 while its sales fell 26.7% year over year and Illicit / Illicit Gardens moved from #4 to #3 with 33.3% sales growth, indicating that Canna Cantina’s stable #2 position amid a declining #1 and a climbing #3 implies a near-term opportunity to challenge the top spot if momentum holds.

Notable Products
Strawberry Watermelon Shot (100mg THC, 2oz, 60ml) delivered the largest month-over-month surge at +65.7% and climbed to rank 4, while Lime Shot (100mg THC, 2oz) fell -15.8% to rank 5. Mango Shot (100mg THC, 2oz) held rank 1 with +18.2% MoM, and Fruit Punch Shot (100mg THC, 2oz) sat at rank 2 with +21.1% MoM, indicating gains clustered at the top despite a -46.5% slide at rank 9 for Dankchata Shot (100mg THC, 2oz). All ten of the top products in May 2026 are Beverages, concentrating the lineup entirely in one category and pointing to a strategy centered on flavor variety within shots rather than category expansion. The pattern implies Canna Cantina is doubling down on high-velocity beverage SKUs, using flavor innovation to offset volatility in trailing items and consolidate share at the top of the ranking.
Top Selling Cannabis Brands
Data for this report comes from real-time sales reporting by participating cannabis retailers via their point-of-sale systems, which are linked up with Headset’s business intelligence software. Headset’s data is very reliable, as it comes digitally direct from our partner retailers. However, the potential does exist for misreporting in the instance of duplicates, incorrectly classified products, inaccurate entry of products into point-of-sale systems, or even simple human error at the point of purchase. Thus, there is a slight margin of error to consider. Brands listed on this page are ranked in the top twenty within the market and product category by total retail sales volume.

