Jun-2026
Sales
Trend
6-Month
Product Count
SKUs
Avg Price
YoY Sales Change
YoY Price Change
Market Insights Snapshot
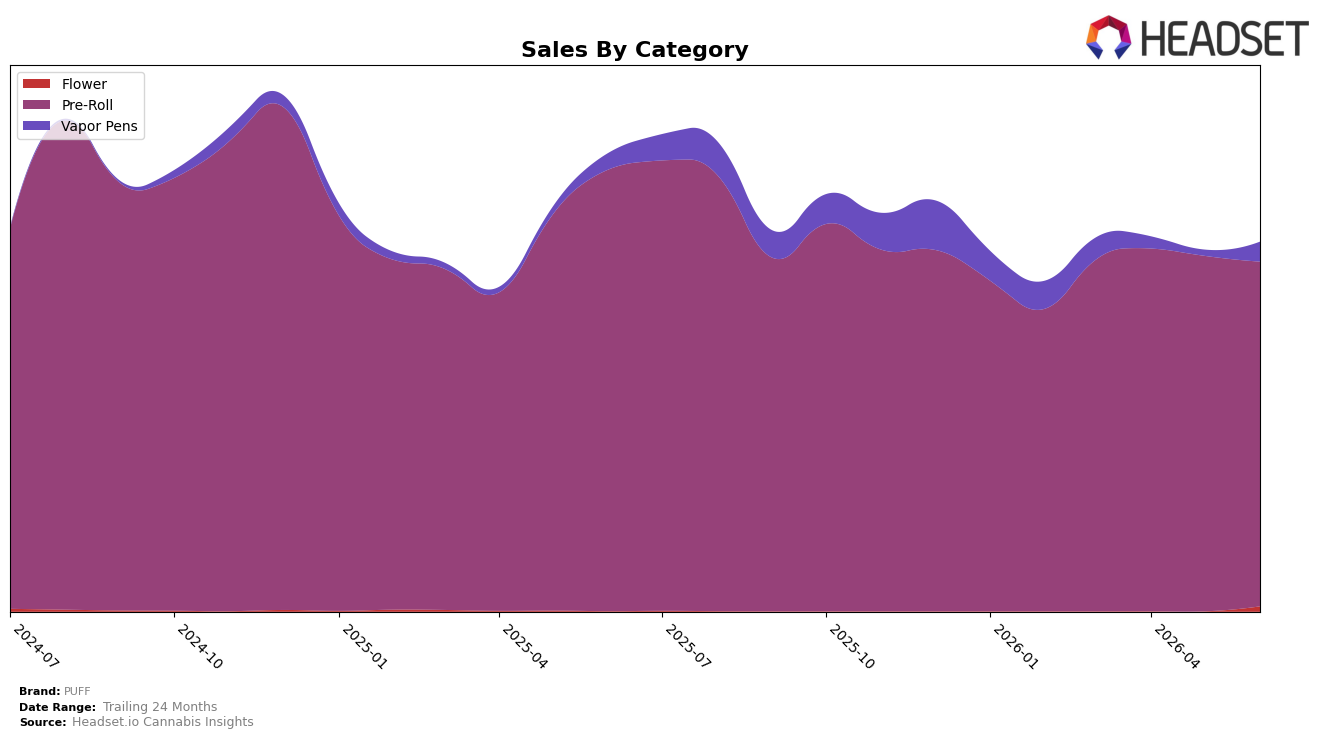
PUFF’s mix in June 2026 is concentrated in Pre-Roll at 93.36% share, where sales declined 21.95% year over year and 3.03% month over month, while overall brand sales fell 19.39% year over year and average price slipped 0.37%. Vapor Pens expanded to 5.30% share with a 236.41% month-over-month jump and 20.58% year-over-year growth, and Flower entered at 1.35% share with a 2,844.19% year-over-year increase from a negligible base; meanwhile, in California Pre-Roll the brand sits at rank 18. The pattern implies PUFF is overexposed to a contracting Pre-Roll base while a rapid but small Vapor Pens and nascent Flower contribution begins diversifying risk, yet the current rank position suggests the Pre-Roll decline still defines market visibility.
With 93.36% of sales tied to Pre-Roll and a rank of 18 in California Pre-Roll, PUFF’s dependence on a category down 21.95% year over year positions the brand for share volatility if the 3.03% month-over-month dip persists. The 236.41% month-over-month surge in Vapor Pens and the 20.58% year-over-year growth there, alongside a 2,844.19% year-over-year lift in Flower, indicate early traction in categories where average prices are $33.93 and $69.92 respectively versus $10.20 in Pre-Roll; the implication is that modest reweighting toward higher-priced formats could offset the 19.39% brand sales decline without requiring large volume gains.
Competitive Landscape
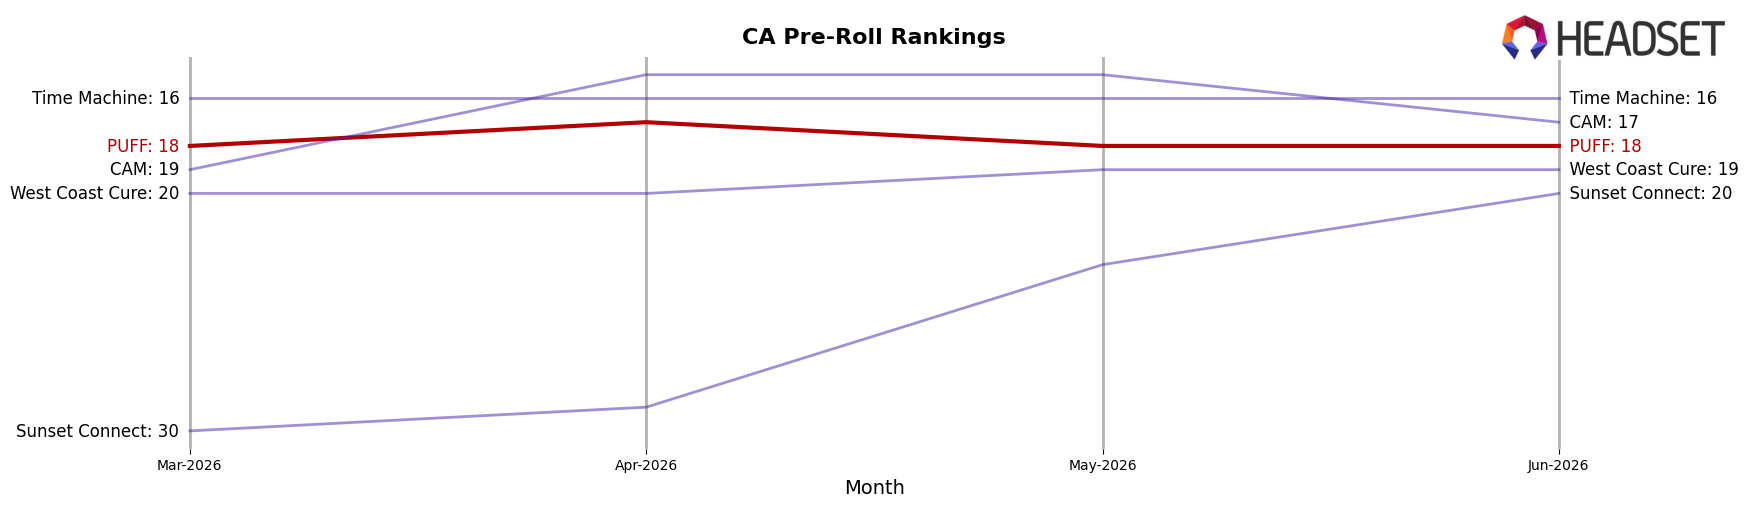
PUFF sits at rank #18 in CA Pre-Roll in June 2026, down 3 positions year over year from #15, and flat versus March 2026 at #18; that stall contrasts with CannaBiotix (CBX) moving from #7 to #4 and Jeeter holding #1 with a 0.7% YoY sales uptick while PUFF ceded 3 ranks from its June 2025 peak at #15. With STIIIZY steady at #2 and Kingpen steady at #3 as PUFF remains outside the top 15, the relative rank erosion and lack of quarter-over-quarter movement imply PUFF is being outpaced by stable leaders and faster climbers, signaling a need to shift toward regaining share in mid-tier slots.
Notable Products
Lemon Wreck Pre-Roll (1g) set the month’s tone with a -43.8% MoM drop while holding rank 8, signaling a sharp pullback even as Headband Pre-Roll (1g) in rank 1 grew 8.6% MoM. Lemon Cherry Gelato Pre-Roll (1g) climbed 37.5% MoM at rank 2, outpacing Sour Diesel Pre-Roll (1g) at rank 3 with 19.1% MoM, and the spread between ranks 1 and 3 sat within roughly 12 percentage points of growth. Four of the top ten are flavor-led Gelato or dessert-leaning SKUs within Pre-Roll, while Alien OG Pre-Roll (1g) dipped 2.5% MoM at rank 9 as Uplift - Cereal Milk Pre-Roll (1g) advanced 23.9% MoM at rank 4, and total dollar concentration among the top five neared $121,000. The pattern implies PUFF is consolidating demand in Pre-Roll around sweeter, modern strains while pruning underperforming legacy cuts, tilting the portfolio toward momentum SKUs rather than breadth.
Top Selling Cannabis Brands
Data for this report comes from real-time sales reporting by participating cannabis retailers via their point-of-sale systems, which are linked up with Headset’s business intelligence software. Headset’s data is very reliable, as it comes digitally direct from our partner retailers. However, the potential does exist for misreporting in the instance of duplicates, incorrectly classified products, inaccurate entry of products into point-of-sale systems, or even simple human error at the point of purchase. Thus, there is a slight margin of error to consider. Brands listed on this page are ranked in the top twenty within the market and product category by total retail sales volume.

