.svg)


Market Insights Snapshot
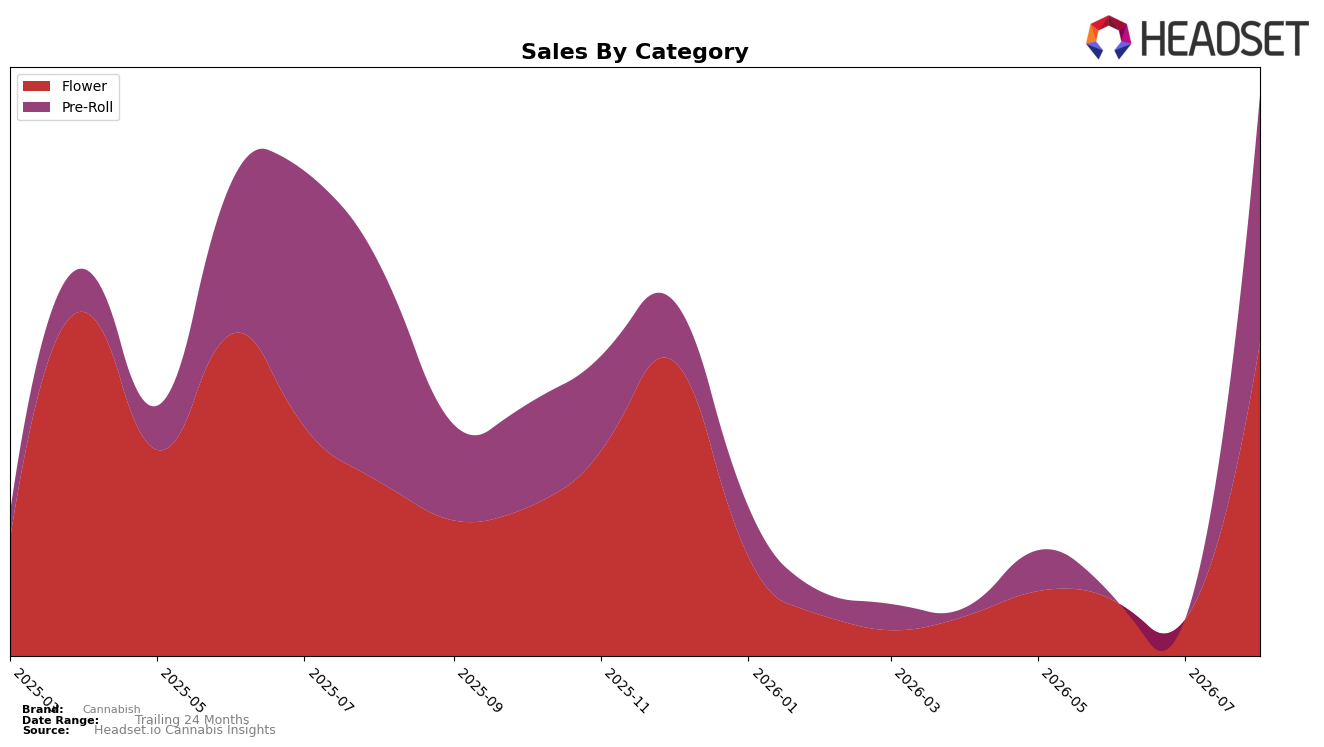
In August 2026, Cannabish concentrated entirely in Flower and Pre-Roll, with Flower at 55.88% share and Pre-Roll at 44.12%, while total brand sales were up 42.67% year over year alongside an 89.39% year-over-year increase in average price. Flower expanded 79.41% YoY and 731.73% MoM at a $33.46 average price, while Pre-Roll grew 13.29% YoY and 16,228.67% MoM at a $9.61 average price; this mix shift, paired with a rank of 54 in Flower within Arizona, implies the brand is leaning into rapid volume recapture in value-entry formats while premium-priced Flower is pulling more revenue weight.
The juxtaposition of a 731.73% MoM spike in Flower with a 16,228.67% MoM surge in Pre-Roll, alongside Flower’s higher price point and 55.88% share, indicates a barbell positioning where premium Flower drives revenue efficiency and Pre-Roll acts as the scale engine. With Flower’s 79.41% YoY gain outpacing Pre-Roll’s 13.29% YoY, yet Pre-Roll closing the gap in share to 44.12% in August 2026, the pattern implies Cannabish can protect margin by sustaining Flower price architecture while using Pre-Roll’s momentum to expand doors and basket entry, especially in Arizona where a rank of 54 suggests headroom to trade shoppers up within the Flower lineup.
Competitive Landscape
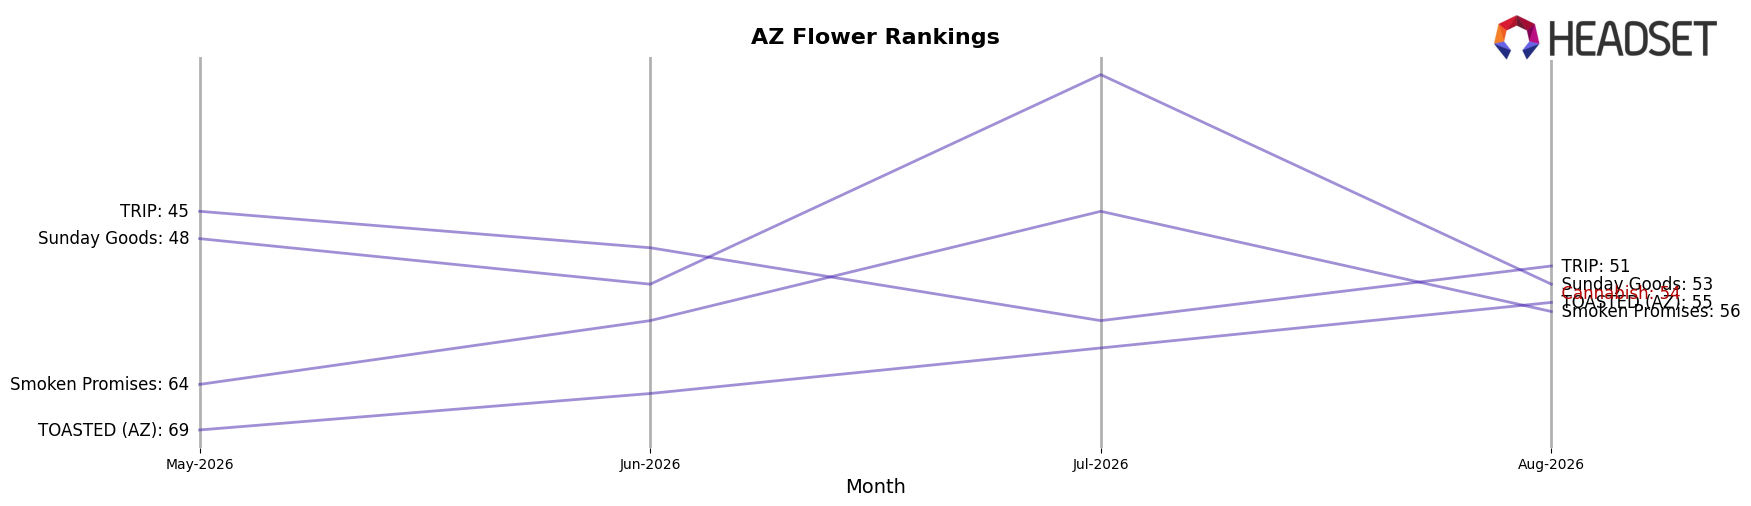
Cannabish sits at rank #54 in AZ Flower in August 2026, improving 12 positions from #66 year over year and climbing 29 spots from #83 three months earlier; this month also marks its peak rank at #54, indicating a recent acceleration rather than a long-held placement. Against category leaders, Just Flower held #1 both year over year and currently while posting a 34.6% YoY sales increase, and Find. moved up from #3 to #2 with a 40.0% YoY lift, whereas Cannabish’s jump from #83 to #54 over three months suggests momentum concentrated in late-quarter gains relative to stable top-tier incumbents. The pattern implies Cannabish’s rank trajectory is consistent with a mid-pack ascent that depends on sustaining recent month-over-month share capture to convert a short-term surge into durable mid-tier presence.
Notable Products
LA Kush Cake (3.5g) posted the largest movement with a 2031.7% month-over-month surge and entered August 2026 at rank 5, while Hashburger (3.5g) rose 387.4% to rank 6. Within the top ten, at least six SKUs are Pre-Rolls clustered at ranks 1 through 4, indicating a category skew even as Flower breaks into ranks 5 and 6. The concentration suggests Cannabish is using Flower spikes to diversify beyond a Pre-Roll-led lineup rather than relying solely on one format.
Top Selling Cannabis Brands






Data for this report comes from real-time sales reporting by participating cannabis retailers via their point-of-sale systems, which are linked up with Headset’s business intelligence software. Headset’s data is very reliable, as it comes digitally direct from our partner retailers. However, the potential does exist for misreporting in the instance of duplicates, incorrectly classified products, inaccurate entry of products into point-of-sale systems, or even simple human error at the point of purchase. Thus, there is a slight margin of error to consider. Brands listed on this page are ranked in the top twenty within the market and product category by total retail sales volume.

