.svg)

Sep-2026
Sales
Trend
6-Month
Product Count
SKUs
Avg Price
YoY Sales Change
YoY Price Change


Where to Buy
Cannavative is stocked at 39 licensed dispensaries across Nevada, with the deepest coverage in Las Vegas, Henderson, Reno, North Las Vegas, and Ely. Search by ZIP code or city below to find the closest one, or filter by product type if you are after a specific format.
Market Insights Snapshot
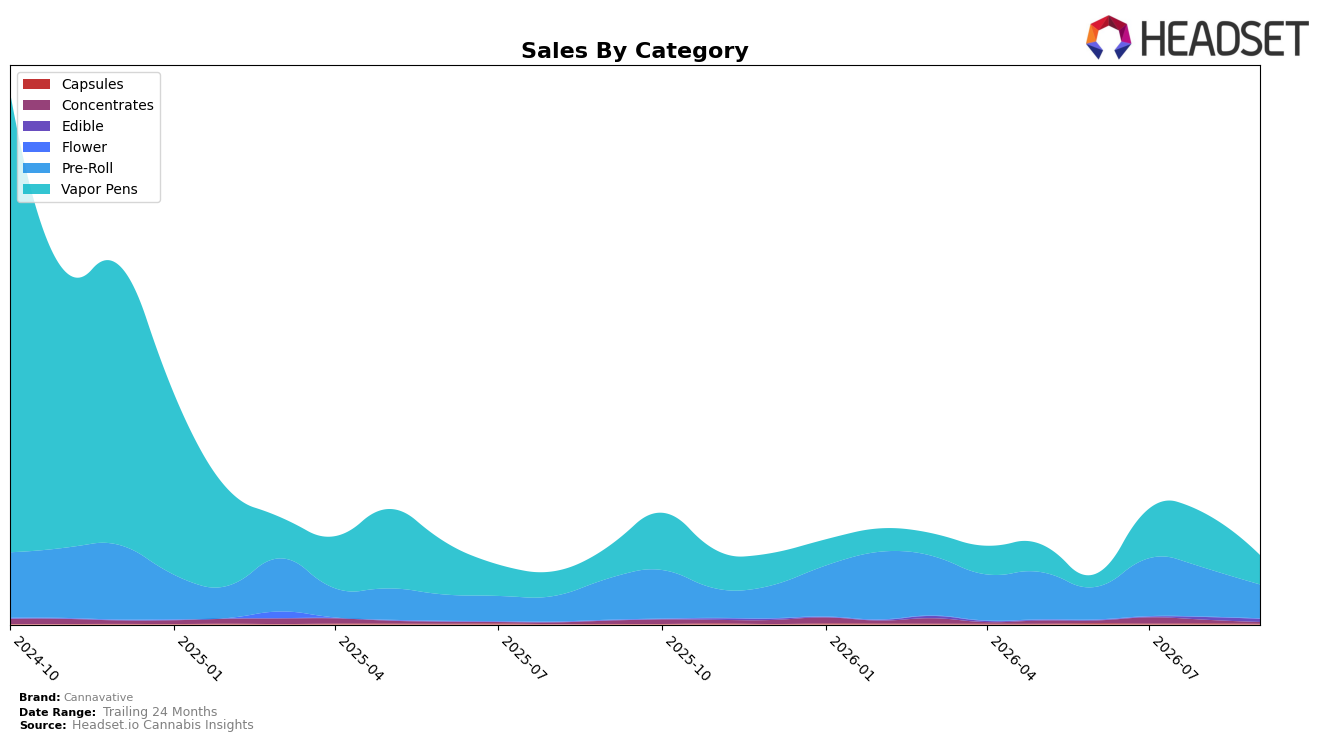
Cannavative concentrated half of September 2026 sales in Pre-Roll at 50.0% share while Vapor Pens held 43.4% share, with Pre-Roll down 18.1% year over year and 30.7% month over month and Vapor Pens down 7.8% year over year and 46.5% month over month; Edible rose 21.4% month over month to 4.1% share, while Concentrates fell 58.0% month over month to 2.0% share and Capsules declined 55.8% month over month despite a 169.2% year-over-year gain. The brand’s overall sales slipped 11.2% year over year while average price rose 7.1%, and within the lead state Nevada the brand ranked 30 in Pre-Roll, implying that the mix is tilting toward lower-velocity SKUs and away from larger basket drivers as Vapor Pens contracted more sharply than Pre-Roll.
The shift toward a Pre-Roll–heavy mix alongside a 30 rank in Nevada Pre-Roll and a 30.7% month-over-month Pre-Roll decline suggests positioning risk if reliance on value-driven units persists, while the 46.5% month-over-month contraction in Vapor Pens and 58.0% in Concentrates indicates weakened participation in premium, higher-price segments. With Edible expanding 21.4% month over month to just 4.1% share and Capsules up 169.2% year over year but only 0.46% share, the pattern implies Cannavative is ceding breadth and price ladder coverage, and would need to stabilize Vapor Pens and recover at least part of Concentrates to improve rank and margin mix.
Competitive Landscape
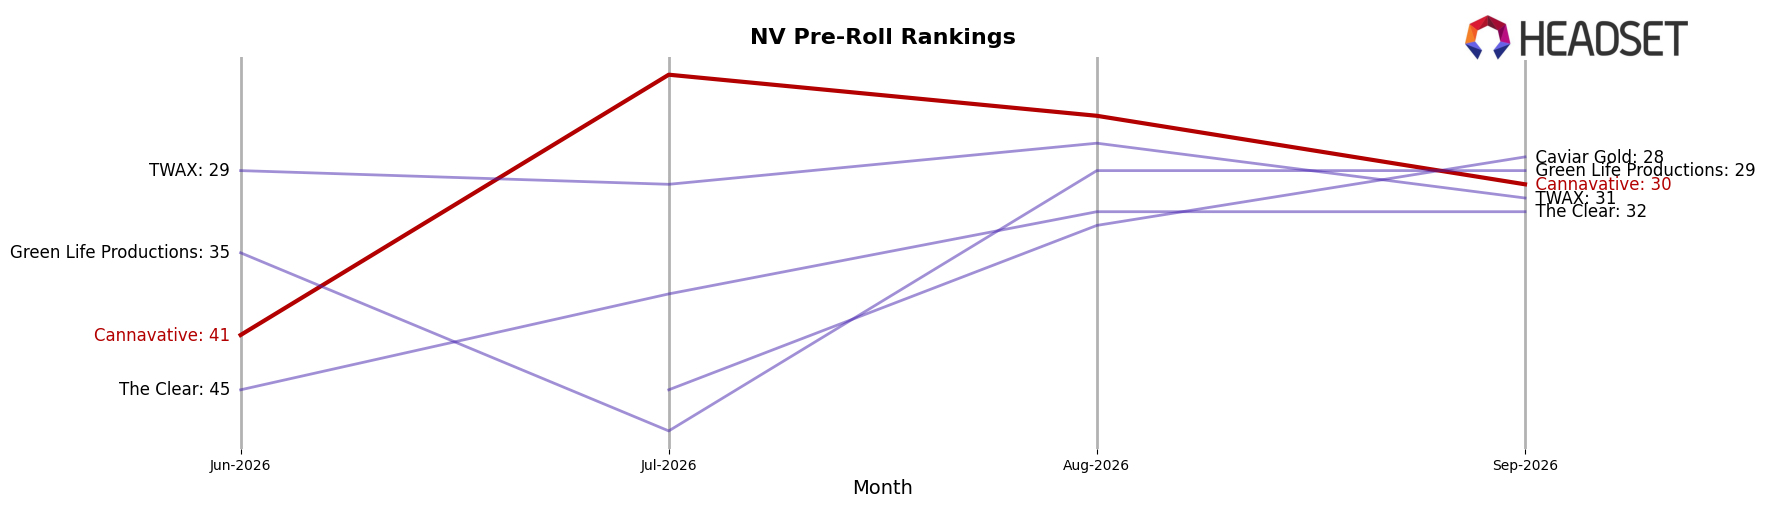
Cannavative sits at rank #30 in NV Pre-Roll for September 2026, down 1 position year over year from #29 and up 11 positions since June 2026 when it was #41; against a longer arc, it remains 14 spots below its peak of #16 in December 2024 and 28 places behind Rove, which rose from #4 to #1 with a 44.6% YoY sales gain, while STIIIZY slipped from #1 to #2 alongside a 39.0% YoY sales decline—this mix of modest rank recovery from recent lows and erosion versus top-tier leaders implies Cannavative is stabilizing off its trough but not yet regaining the share momentum needed to re-enter the mid-teens.
Notable Products
Motivator - Jack and Cake Infused Pre-Roll (1g) posted the largest month-over-month move in September 2026 at +71%, vaulting to rank 1 and setting the tone for Cannavative’s lineup, while Motivator - Tamarindo Infused Pre-Roll (1g) fell -16% to rank 3. Resin8 - Cherry Distillate Cartridge (1g) declined -34% and sat at rank 5 even with a single-month take of $6,480, and Resin8 - Mango Distillate Cartridge (1g) slipped -11% at rank 8. With eight of the top ten in Pre-Roll, the mix is consolidating around infused Motivator SKUs and away from Vapor Pens, implying Cannavative is leaning into Pre-Roll-led velocity over cartridge breadth.
Top Selling Cannabis Brands






Data for this report comes from real-time sales reporting by participating cannabis retailers via their point-of-sale systems, which are linked up with Headset’s business intelligence software. Headset’s data is very reliable, as it comes digitally direct from our partner retailers. However, the potential does exist for misreporting in the instance of duplicates, incorrectly classified products, inaccurate entry of products into point-of-sale systems, or even simple human error at the point of purchase. Thus, there is a slight margin of error to consider. Brands listed on this page are ranked in the top twenty within the market and product category by total retail sales volume.

