Market Insights Snapshot
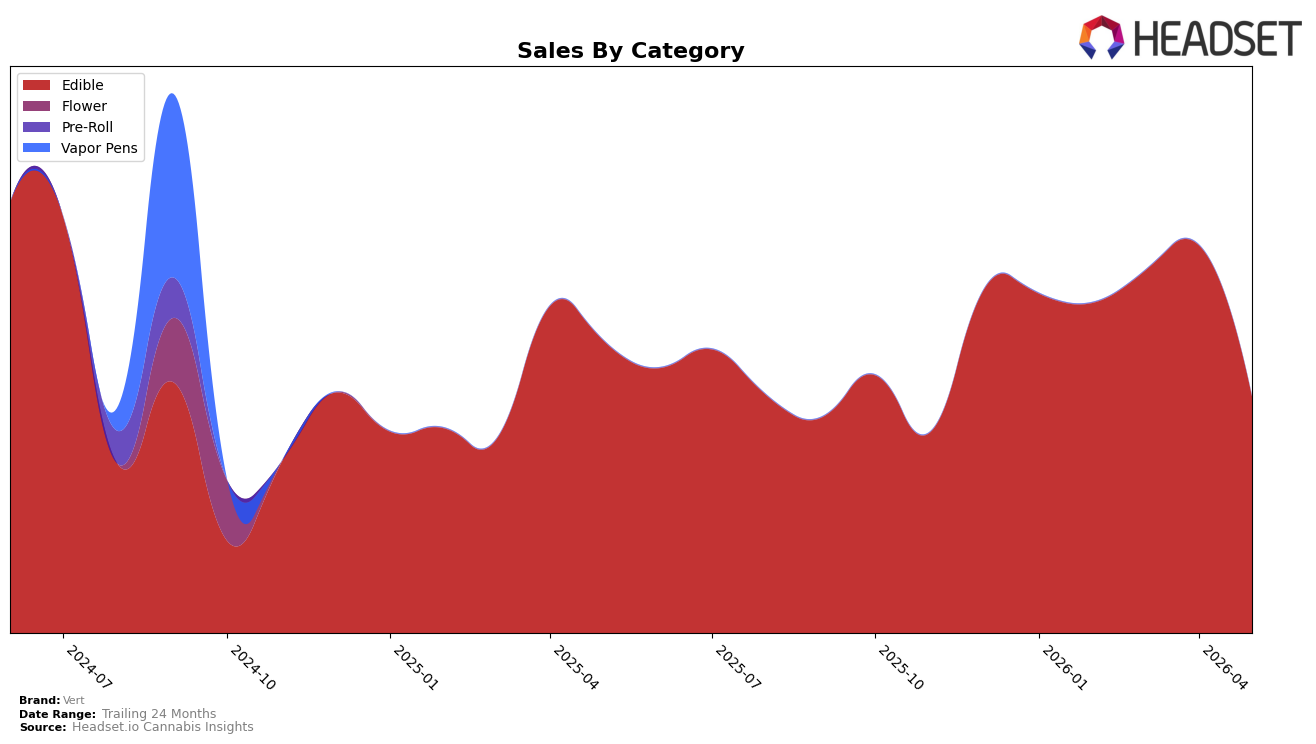
In May 2026, Vert operated as a single-category brand with Edible at 100.0% of mix, amplifying exposure to that segment’s -19.1% year-over-year contraction and -39.1% month-over-month pullback. The average price fell -19.4% YoY to $21.54, matching the sales decline directionally and implying limited unit cushion against the MoM drop alongside a state-category rank of 25 in Nevada. The pattern implies concentration risk: with no category diversification to offset Edible volatility, pricing and volume swings flowed straight through to total performance.
The combination of a -19.1% YoY revenue decline against a -19.4% YoY price cut suggests unit volume was roughly flat YoY, while the -39.1% MoM sales slide outpaced any indicated pricing change, pointing to a demand or distribution shock within Edible for May 2026. Sitting at rank 25 in Nevada Edible while carrying 100.0% category dependence positions Vert as a price-taker rather than a price-setter; the implication is that stabilizing rank and share likely requires either mix expansion beyond Edible or tighter price-pack architecture to reduce sensitivity to monthly demand troughs.
Competitive Landscape
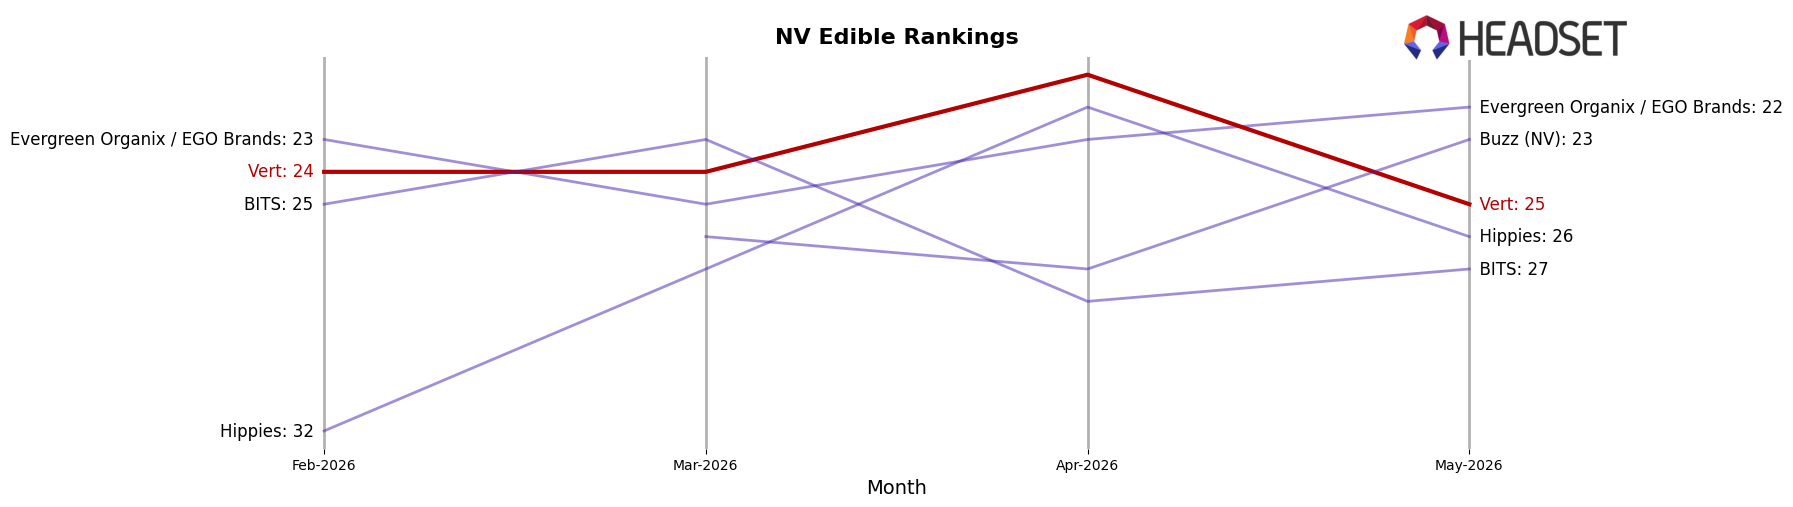
Vert sits at rank 25 in May 2026, a 2-position improvement from rank 27 year over year, but a 1-position slide from rank 24 three months ago, while its peak rank of 21 in April 2026 signals recent volatility; meanwhile, Wyld held rank 1 with a -15.2% year-over-year sales change and Kanha / Sunderstorm rose from rank 10 to rank 4 with +205.8% year-over-year sales, indicating that Vert’s modest rank lift is outpaced by faster-moving leaders and climbers, implying the brand’s trajectory suggests stabilization rather than breakout momentum.
Notable Products
Nice Crispies Peanut Butter Chocolate Bar 10-Pack (100mg) posted the largest movement in May 2026 with +174.7% MoM at rank 6, while Nice Crispies Baked Goods 10-Pack (100mg) rose +99.7% MoM to rank 4. In contrast, Chocolate Chip Brownie Cookie Square (100mg) fell -86.5% MoM at rank 8 and Chocolate Caramel Brownie Cookie Square 10-Pack (100mg) declined -81.4% MoM at rank 9. With four Cookie Squares sitting across ranks 1, 2, 3, and 5 and three of them registering changes of +7.9%, +4.5%, and -33.6%, the surge of two multi-pack Nice Crispies SKUs implies Vert is shifting attention toward value-oriented multipacks over single-cookie formats.
Top Selling Cannabis Brands
Data for this report comes from real-time sales reporting by participating cannabis retailers via their point-of-sale systems, which are linked up with Headset’s business intelligence software. Headset’s data is very reliable, as it comes digitally direct from our partner retailers. However, the potential does exist for misreporting in the instance of duplicates, incorrectly classified products, inaccurate entry of products into point-of-sale systems, or even simple human error at the point of purchase. Thus, there is a slight margin of error to consider. Brands listed on this page are ranked in the top twenty within the market and product category by total retail sales volume.

