Market Insights Snapshot
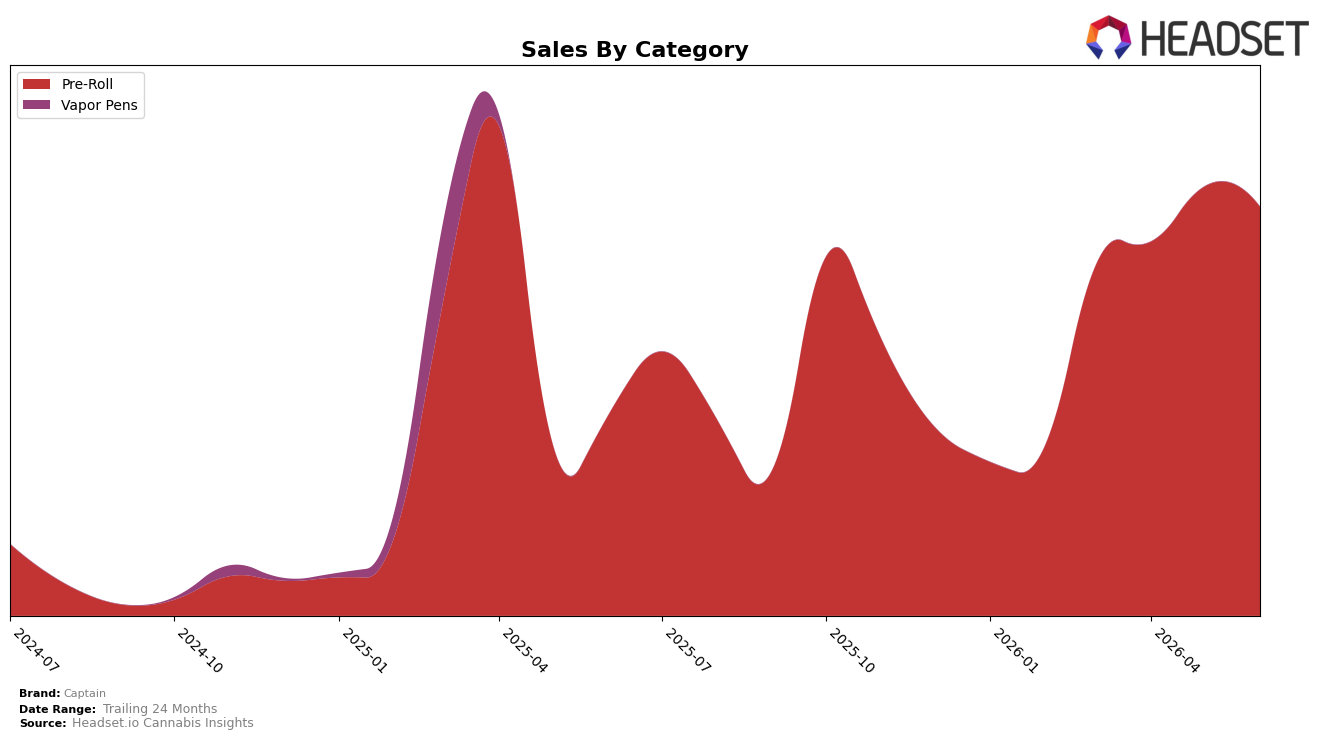
Captain’s category mix in June 2026 is fully concentrated in Pre-Roll at 100.0% share, with year-over-year sales growth of 104.3% alongside a month-over-month decline of 4.7%. The average price rose 29.6% YoY to $7.55 while volume momentum softened MoM, indicating pricing power coexisting with near-term pullback; taken together with the brand’s overall 104.3% YoY sales increase and a 789.2% 24-month gain, the pattern implies that a single-category strategy is scaling but now encountering short-cycle volatility that could pressure repeat velocity if price-led gains outpace demand.
Within Colorado Pre-Rolls, Captain sits at rank 28 while holding 100.0% of its mix in the same category, and that combination with a 4.7% MoM decline suggests limited insulation from rank movement if the segment tightens. The intersection of a 29.6% YoY price lift and a rank in the high 20s implies the brand is trading on value-per-unit rather than assortment breadth; to improve positional durability, the data points to either defending price while lifting conversion within Pre-Roll or selectively diversifying so that June 2026’s single-category exposure does not translate small MoM dips into outsized share risk.
Competitive Landscape
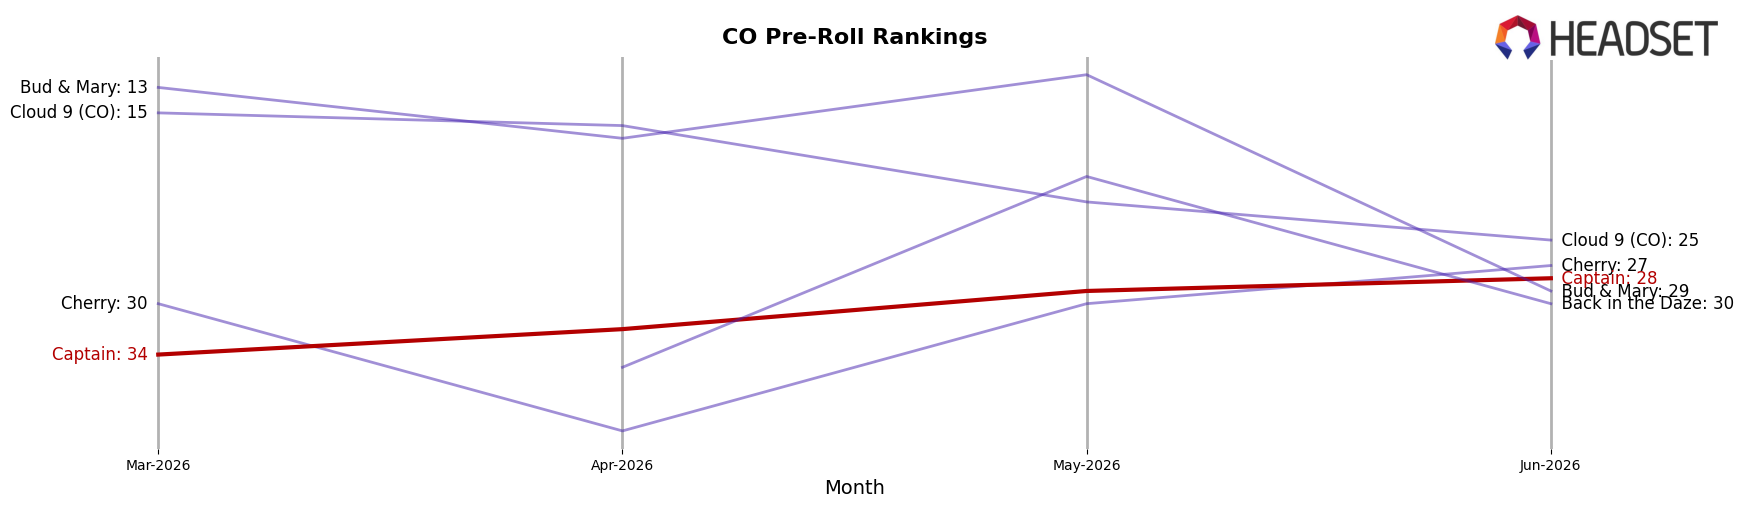
Captain sits at rank #28 in CO Pre-Roll for June 2026, improving 28 positions year over year from #56, and it rose 6 ranks from #34 three months prior to #28 while still trailing its April 2025 peak of #27 by 1 position; meanwhile, Green Dot Labs advanced from #2 to #1 as its sales grew 48.4% year over year and Cali-Blaze slipped from #1 to #2 alongside a 2.3% year-over-year sales decline, indicating that Captain’s steady climb amid top-tier reshuffling points to share capture from mid-pack rivals rather than direct pressure on the top five.
Notable Products
Chimera Pre-Roll (1g) posted the standout move with a +215% month-over-month surge to rank 1 in June 2026, while Mr. Big Stuff Pre-Roll (1g) fell -43% to rank 4 and Zero Dark Gary Pre-Roll (1g) dropped -45% to rank 9. Plank-Walkers Pre-Roll 5-Pack (2.5g) slipped -12% at rank 7, and four of the top ten are Pre-Roll 1g SKUs, pointing to a tilt toward single-stick velocity over multi-pack depth. This mix implies Captain is consolidating share around a breakout hero SKU and de-emphasizing slower 1g tails and multi-pack formats.
Top Selling Cannabis Brands
Data for this report comes from real-time sales reporting by participating cannabis retailers via their point-of-sale systems, which are linked up with Headset’s business intelligence software. Headset’s data is very reliable, as it comes digitally direct from our partner retailers. However, the potential does exist for misreporting in the instance of duplicates, incorrectly classified products, inaccurate entry of products into point-of-sale systems, or even simple human error at the point of purchase. Thus, there is a slight margin of error to consider. Brands listed on this page are ranked in the top twenty within the market and product category by total retail sales volume.

