.svg)
Aug-2026
Sales
Trend
6-Month
Product Count
SKUs
Avg Price
YoY Sales Change
YoY Price Change


Where to Buy
Globs is stocked at 64 licensed dispensaries across California, with the deepest coverage in Santa Rosa, San Jose, San Diego, Santa Cruz, and Arcata. Search by ZIP code or city below to find the closest one, or filter by product type if you are after a specific format.
Market Insights Snapshot
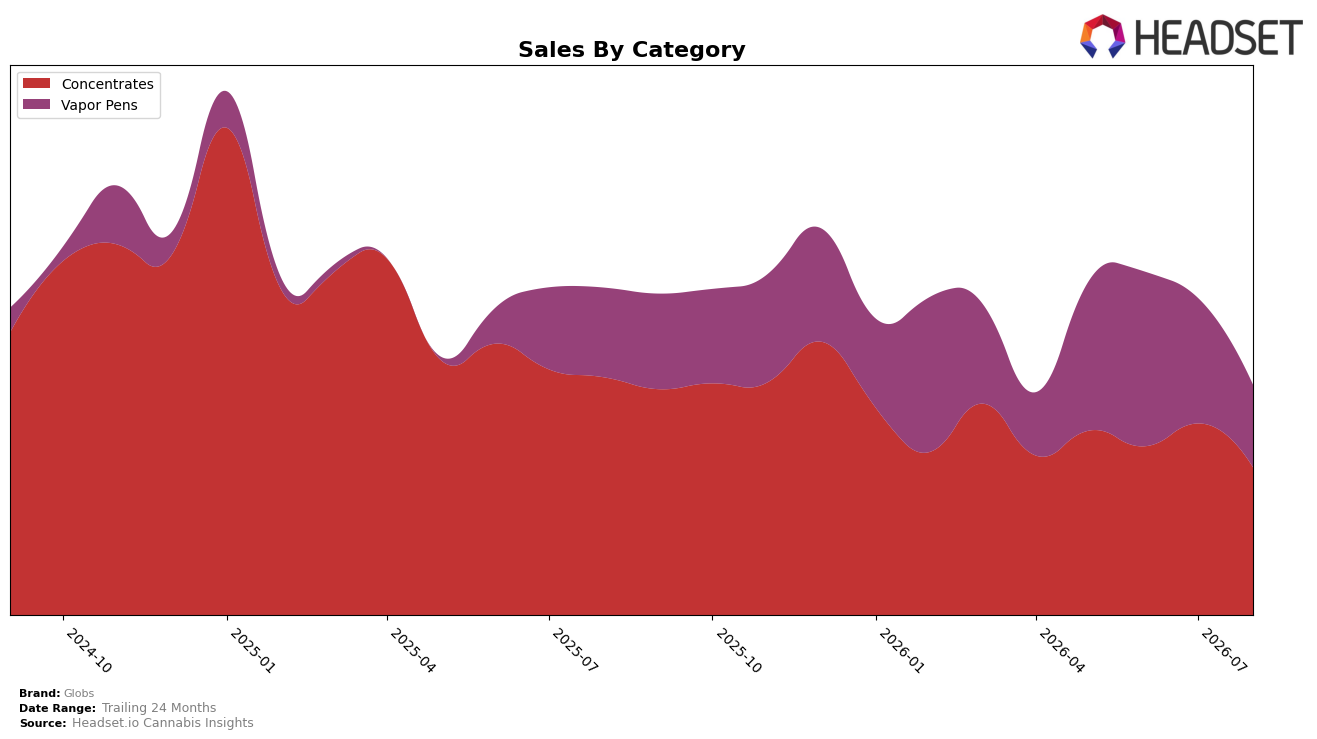
Globs concentrated its August 2026 mix in two categories, with Concentrates at 59.52% share and Vapor Pens at 40.48% share, while total brand sales fell 22.11% year over year and 32.09% over 24 months. Within the mix, Concentrates declined 30.66% YoY and 17.75% MoM, versus Vapor Pens down 4.85% YoY and 23.63% MoM, indicating sharper month-to-month pressure in Vapor Pens despite a milder annual drop. Average price edged up 0.69% YoY to $17.45, with category price dispersion (Concentrates at $15.12 vs Vapor Pens at $22.57) implying a tilt toward higher ticket units not offsetting volume compression. The pattern implies Globs is overexposed to a contracting Concentrates base while the quicker MoM slide in Vapor Pens reduces the near-term buffer that previously tempered annual losses.
Positioning-wise, a 38th rank in Concentrates in California alongside a 30.66% YoY drop in that category suggests limited pull from the core segment, while Vapor Pens’ 4.85% YoY decline but 23.63% MoM fall points to recent distribution or promo gaps. With Concentrates at 59.52% share and Vapor Pens at 40.48% share, the current mix leans toward the weaker annual performer, yet the steeper MoM contraction in Vapor Pens signals short-term volatility if mix shifts accelerate. The implication is that stabilizing Vapor Pens to mitigate month-level swings, while selectively pruning underperforming Concentrates SKUs, would better align Globs with categories that can support rank improvement without further compressing price or margin.
Competitive Landscape
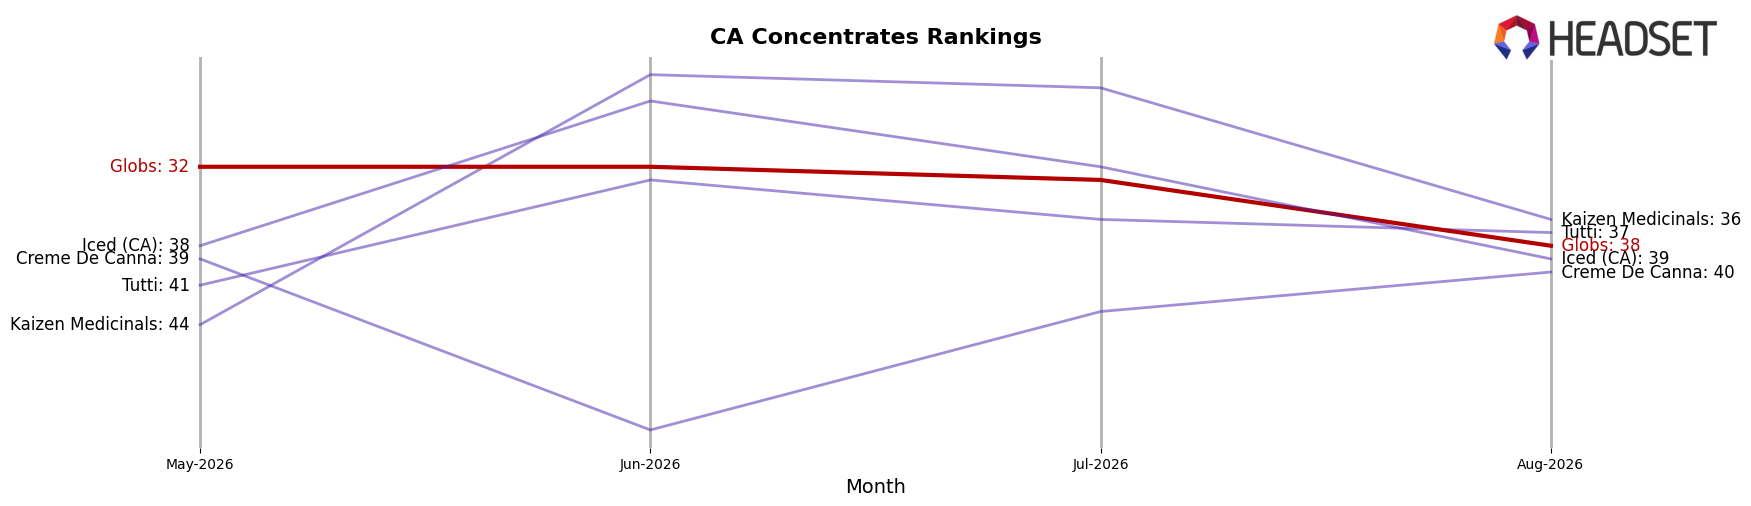
Globs is ranked #38 in CA Concentrates in August 2026, down 8 positions year over year from #30 and 6 positions lower than three months ago at #32, while still sitting 22 ranks below its January 2025 peak at #16; in contrast, Raw Garden held #1 with a 9.9% year-over-year sales increase and 710 Labs advanced from #4 to #2 with 33.5% year-over-year growth, whereas STIIIZY slipped from #2 to #3 alongside a 2.3% sales decline. The directional gap is widening as category leaders either maintain #1 stability or climb 2 ranks into the top 2, while Globs’ 8-rank annual decline and 6-rank quarter-over-quarter drop indicate a deteriorating share position that implies recovery will require outpacing competitors’ double-digit gains rather than merely returning to last year’s level.
Notable Products
Grandma's Cookies Badder (1g) posted the steepest decline in August 2026, down 68.3% MoM while sliding to rank 6, and Modified Berries Badder (1g) fell 43.8% MoM at rank 5, signaling sharp contraction concentrated in mid-tier slots. At the top, Sweet-N-Sour Diesel Badder (1g) still held rank 1 despite a 27.4% MoM drop, while Ice Cream Paint Job Badder (1g) at rank 3 declined 14.5% MoM, indicating that leadership is intact but weakening. Vapor Pens were steadier, with GDP Live Resin Cartridge (1g) at rank 10 shrinking a smaller 13.0% MoM and Ice Cream Paint Job Live Resin Cartridge (1g) debuting at rank 7 with $7,270, suggesting diversification away from volatile Concentrates. With nine of the top ten coming from Concentrates, the pattern implies Globs is overexposed to a category experiencing broad MoM declines, nudging the mix toward Vapor Pens to reduce volatility and protect rank share.
Top Selling Cannabis Brands






Data for this report comes from real-time sales reporting by participating cannabis retailers via their point-of-sale systems, which are linked up with Headset’s business intelligence software. Headset’s data is very reliable, as it comes digitally direct from our partner retailers. However, the potential does exist for misreporting in the instance of duplicates, incorrectly classified products, inaccurate entry of products into point-of-sale systems, or even simple human error at the point of purchase. Thus, there is a slight margin of error to consider. Brands listed on this page are ranked in the top twenty within the market and product category by total retail sales volume.

