Market Insights Snapshot
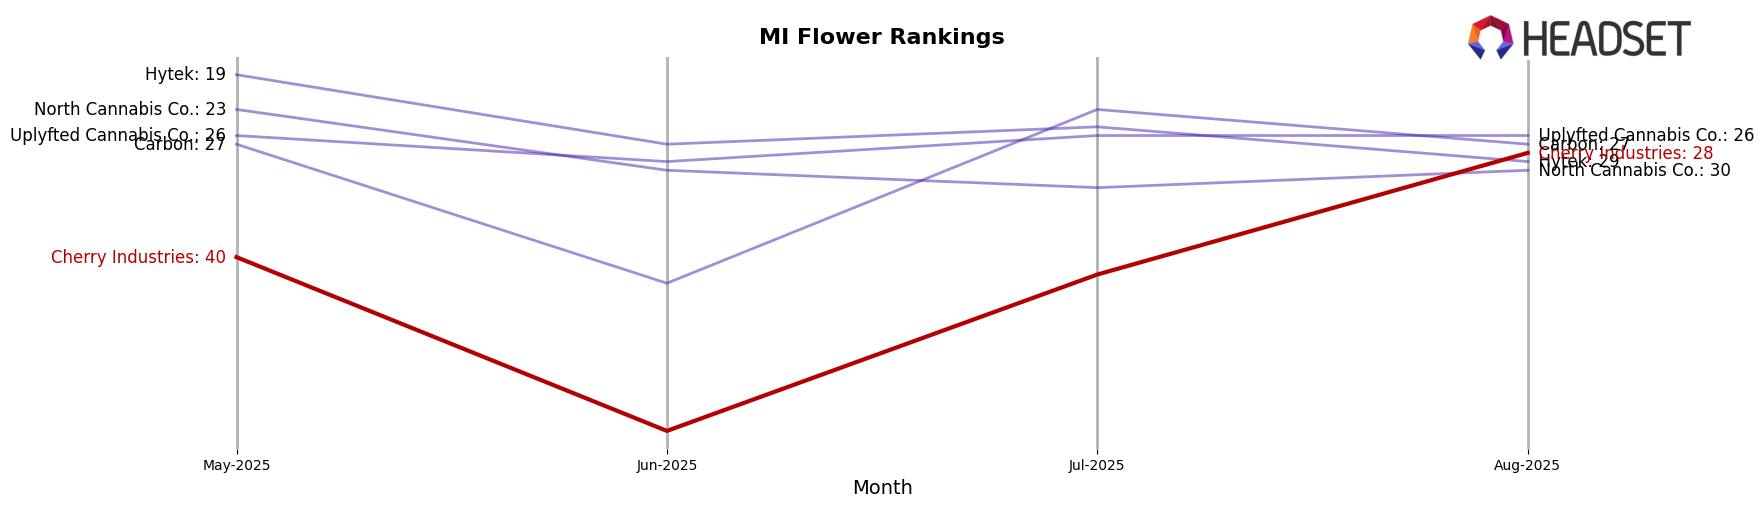
Cherry Industries has shown significant fluctuation in its performance across different categories and states, with notable movements in the Michigan market. In the Flower category, Cherry Industries started outside the top 30 in May and June 2025, ranking 40th and 60th, respectively. However, the brand made a substantial leap to 28th place by August 2025, indicating a positive trend in sales and market presence. This upward trajectory is particularly impressive given the competitive nature of the Flower category, suggesting Cherry Industries is effectively capturing consumer interest and possibly expanding its distribution or product offerings.
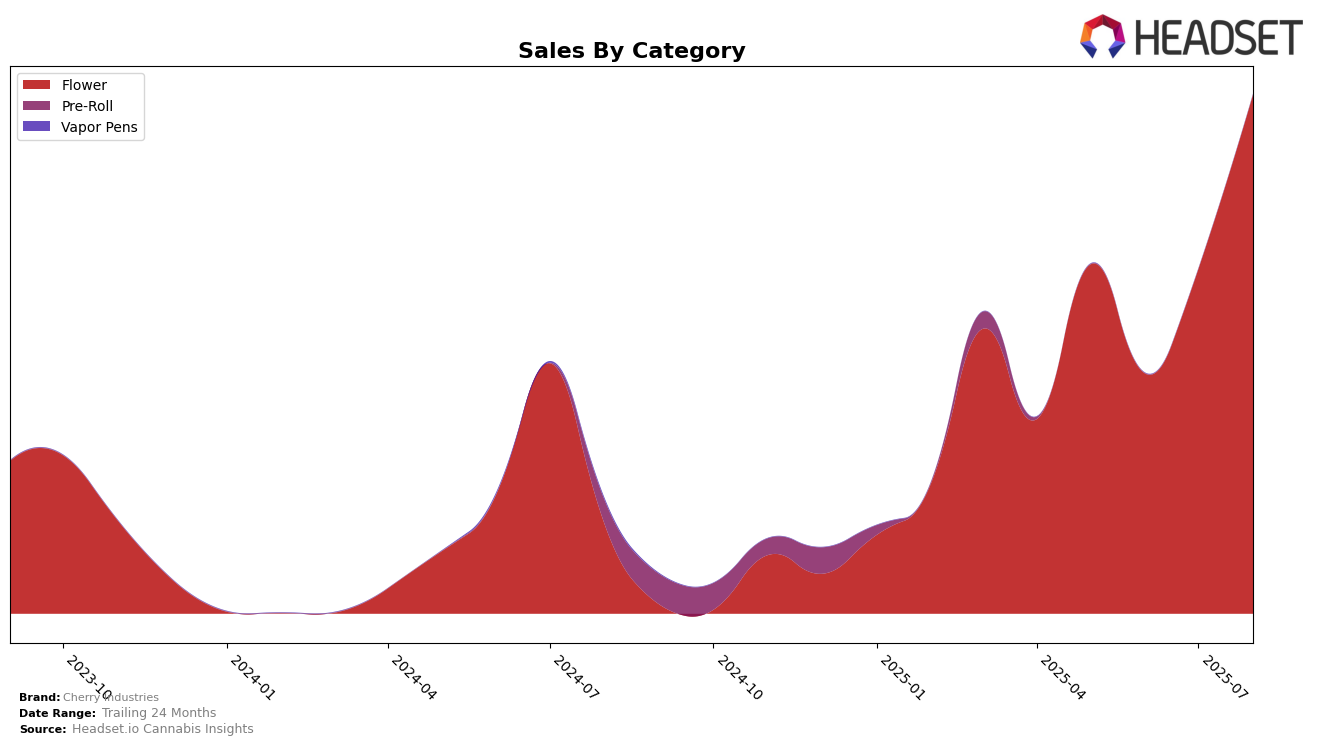
While the brand's performance in Michigan's Flower category improved, it's crucial to note that Cherry Industries was absent from the top 30 rankings in other states and categories during these months, which could signal areas for potential growth or concern. The absence in these rankings might reflect limited market penetration or strong competition in those regions. Despite these challenges, Cherry Industries experienced a notable increase in sales from June to August 2025, with sales jumping from $435,563 to $944,953. This growth highlights the brand's potential and resilience, suggesting that with strategic initiatives, Cherry Industries could enhance its positions in other markets as well.
Competitive Landscape
In the competitive landscape of the Michigan flower category, Cherry Industries has shown a notable upward trajectory in recent months. After starting at a rank of 40 in May 2025, Cherry Industries climbed to a rank of 28 by August 2025, reflecting a significant improvement in market position. This upward movement is particularly impressive compared to competitors like North Cannabis Co. and Hytek, both of which experienced fluctuations and declines in their rankings over the same period. Meanwhile, Uplyfted Cannabis Co. maintained a consistent rank of 26, and Carbon showed a slight improvement, ending at rank 27 in August. Cherry Industries' sales also saw a substantial increase, aligning with its improved rank, suggesting effective strategies in capturing market share and consumer interest. This positive trend positions Cherry Industries as a rising competitor in the Michigan flower market, indicating potential for further growth and increased market influence.
Notable Products
In August 2025, the top-performing product for Cherry Industries was White Pie Runtz (Bulk) in the Flower category, which secured the first rank with sales of 2872 units. Gorilla Glue #4 (Bulk), also in the Flower category, held the second position, a slight drop from its first-place ranking in May 2025. Super Boof (Bulk) made a notable entry into the top three, climbing from fourth place in May 2025 to third in August. El Chivo (Bulk) debuted at fourth place in August, while Cherry Candy (Bulk) slipped from its previous first and fourth positions in June and July, respectively, to fifth place. This shift in rankings indicates a dynamic and competitive market landscape within the Flower category for Cherry Industries.
Top Selling Cannabis Brands
Data for this report comes from real-time sales reporting by participating cannabis retailers via their point-of-sale systems, which are linked up with Headset’s business intelligence software. Headset’s data is very reliable, as it comes digitally direct from our partner retailers. However, the potential does exist for misreporting in the instance of duplicates, incorrectly classified products, inaccurate entry of products into point-of-sale systems, or even simple human error at the point of purchase. Thus, there is a slight margin of error to consider. Brands listed on this page are ranked in the top twenty within the market and product category by total retail sales volume.

