Jun-2026
Sales
Trend
6-Month
Product Count
SKUs
Avg Price
YoY Sales Change
YoY Price Change
Market Insights Snapshot
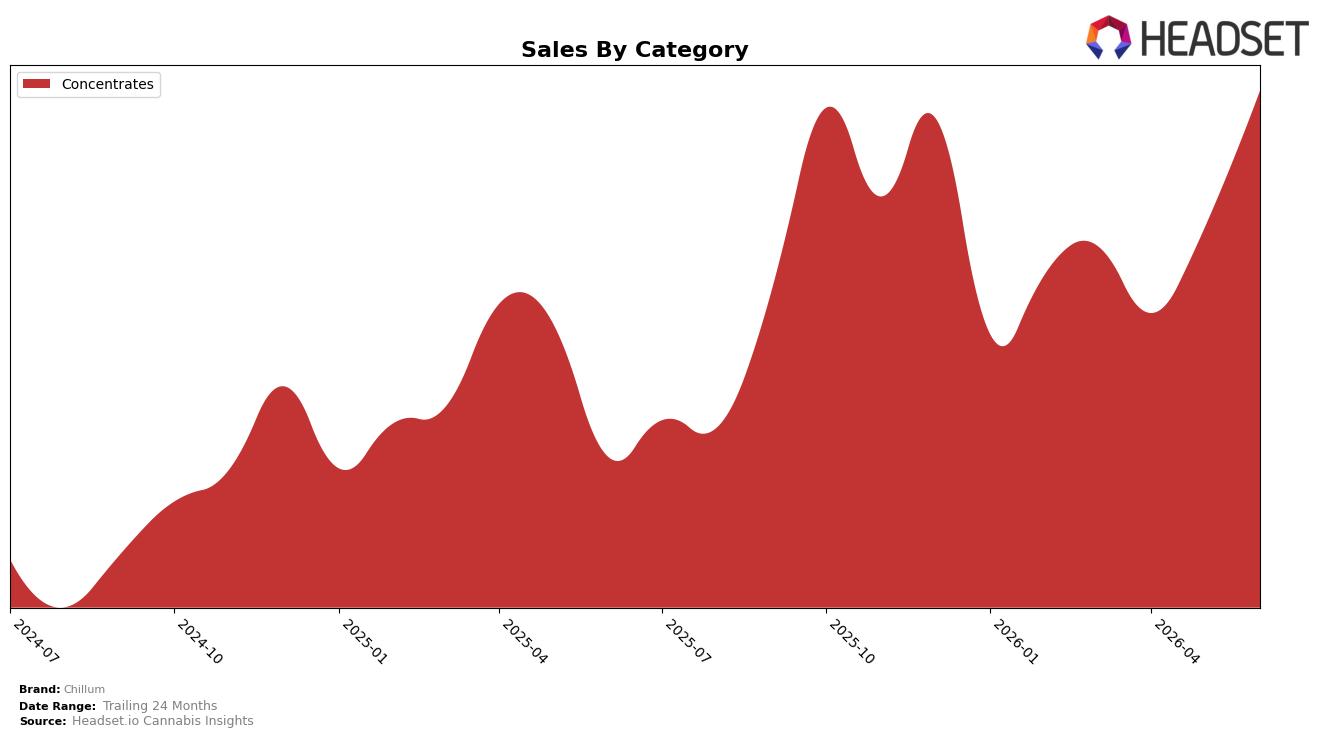
In June 2026, Chillum operated as a single-category brand with Concentrates at 100.0% of sales share, posting year-over-year growth of 70.8% alongside month-over-month growth of 18.4%. Average price rose 3.5% YoY to $34.75 while category share concentration remained at 100.0%, and rank in Ontario Concentrates sat at 18. The pattern implies deliberate focus on one category is lifting velocity faster than pricing, with mid-teen MoM growth indicating near-term demand momentum without dilution of the category mix.
The sustained 100.0% reliance on Concentrates, combined with a rank of 18 and 70.8% YoY growth, suggests Chillum is trading depth for breadth to climb within a crowded tier. With 18.4% MoM growth coexisting with only a 3.5% YoY price increase, volume is carrying share rather than premium pricing, implying positioning as a consistent mover in Ontario Concentrates that can press for rank gains through distribution and assortment rather than price-led strategies.
Competitive Landscape
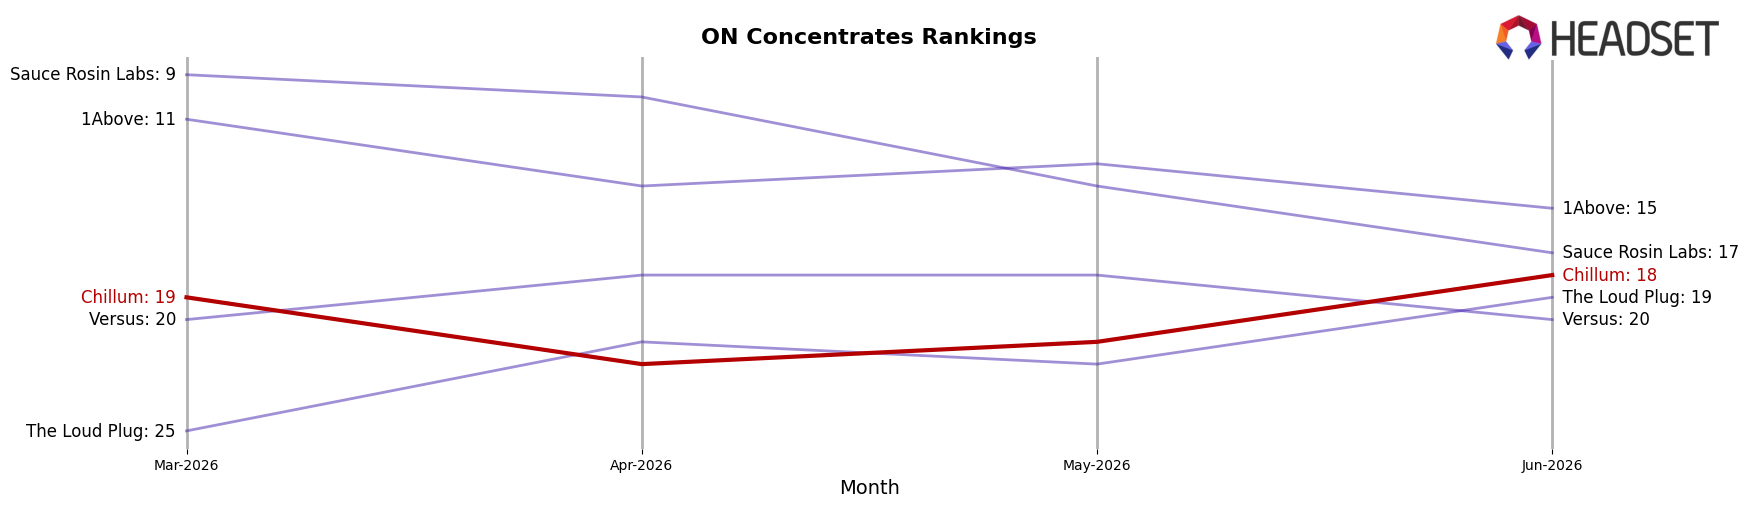
Chillum sits at rank #18 in ON Concentrates in June 2026, improving 7 positions from #25 year over year, and edging up 1 spot from #19 in March 2026, while peers moved more sharply: Pura Vida advanced from #4 to #2 with a 49.2% year-over-year sales change, whereas Nugz (Canada) slipped from #2 to #3 alongside a -6.6% decline, and category leader Vortex Cannabis Inc. held #1 despite a -1.8% contraction. With a peak rank matching its current #18 in June 2026 and competitors either accelerating or softening, the gradual rank gain implies Chillum’s trajectory is incremental share capture rather than breakout displacement.
Notable Products
Black Hash (3.5g) posted a month-over-month change of +18.4% and held rank 1 in June 2026, indicating the lead SKU is growing share without ceding position. With only one top-10 SKU reported and 100% of tracked sales concentrated in Concentrates, the mix is narrow and anchored in a single format. The absence of rank movement alongside double-digit growth implies demand depth within the lead SKU rather than breadth across a portfolio. This pattern implies Chillum is pursuing a focused strategy around a flagship concentrate rather than diversifying across multiple product families.
Top Selling Cannabis Brands
Data for this report comes from real-time sales reporting by participating cannabis retailers via their point-of-sale systems, which are linked up with Headset’s business intelligence software. Headset’s data is very reliable, as it comes digitally direct from our partner retailers. However, the potential does exist for misreporting in the instance of duplicates, incorrectly classified products, inaccurate entry of products into point-of-sale systems, or even simple human error at the point of purchase. Thus, there is a slight margin of error to consider. Brands listed on this page are ranked in the top twenty within the market and product category by total retail sales volume.

