Jun-2026
Sales
Trend
6-Month
Product Count
SKUs
Avg Price
YoY Sales Change
YoY Price Change
Market Insights Snapshot
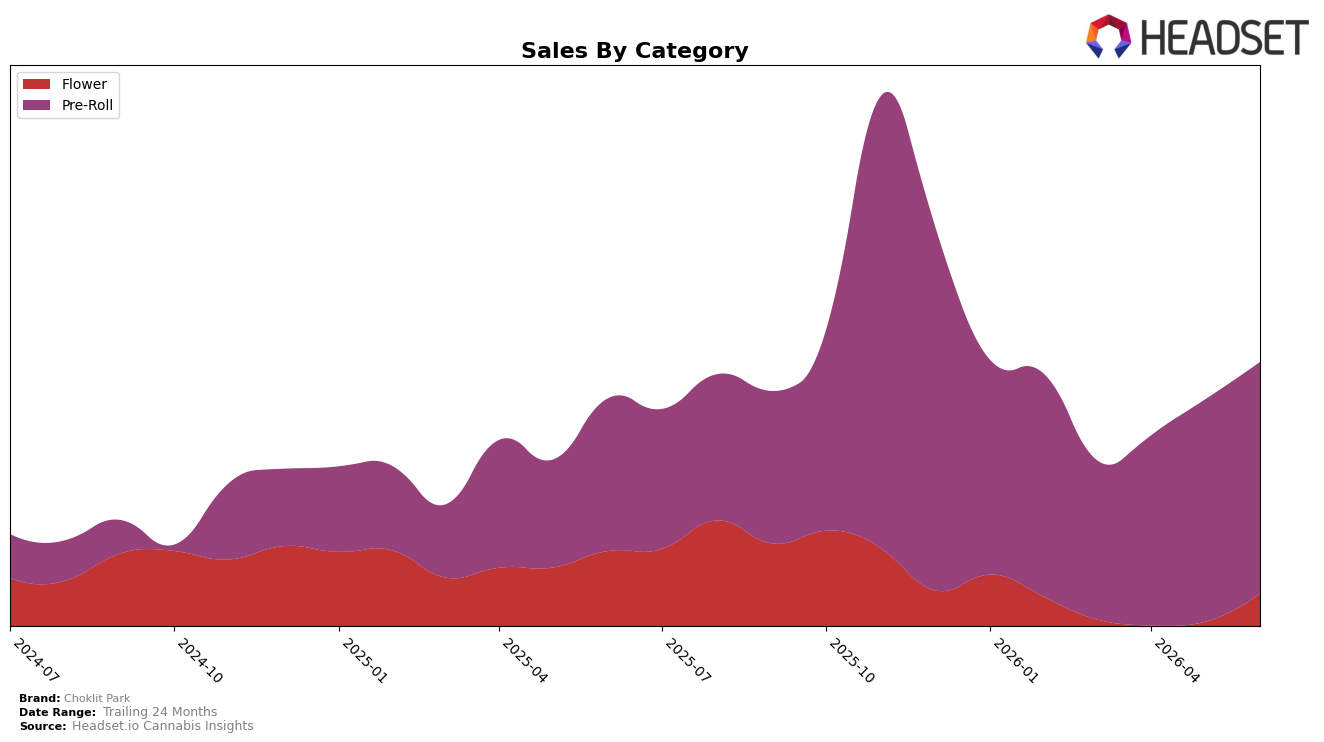
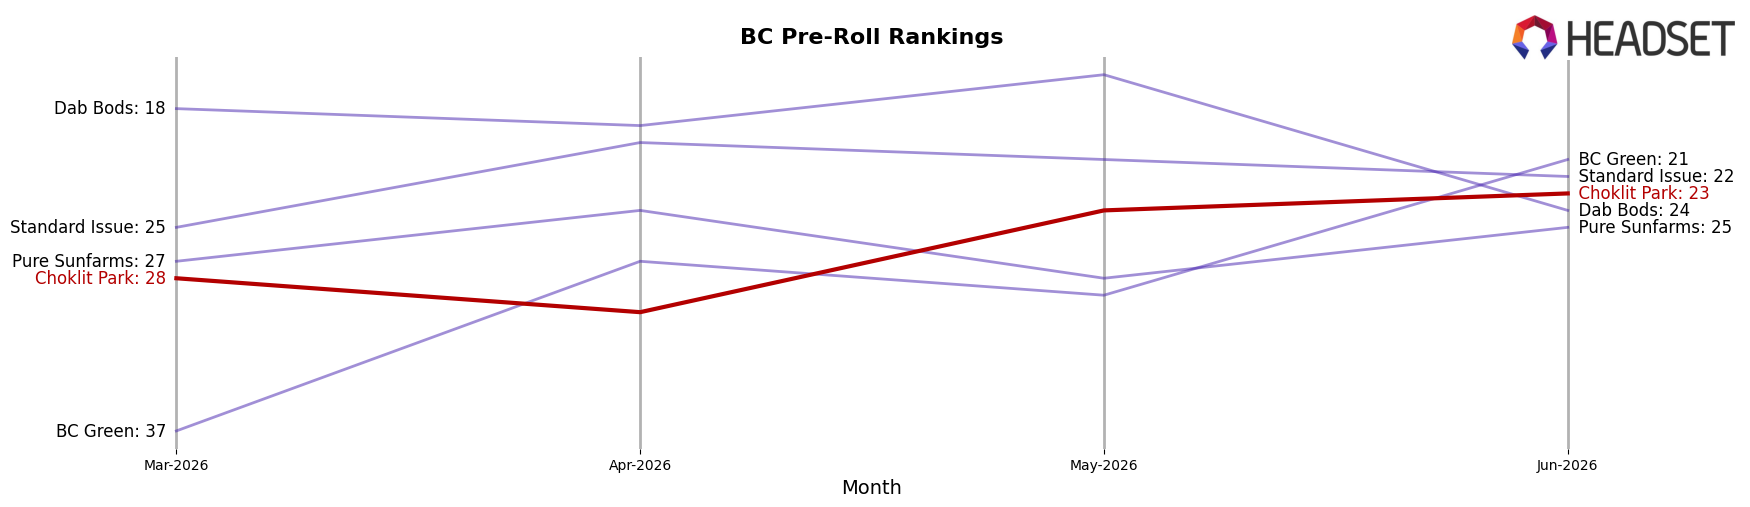
Choklit Park concentrated 82.69% of June 2026 sales in Pre-Roll, where sales grew 45.43% year over year and 3.80% month over month, while Flower carried 17.31% share with a 118.20% month-over-month rebound but a 44.60% year-over-year decline; the average price fell 21.97% year over year to $25.67 alongside a Pre-Roll average at 24.00. Within Pre-Roll in British Columbia, the brand sat at rank 23, indicating category depth even as overall brand sales rose 13.50% year over year and expanded 125.51% over 24 months, implying a volume-led mix where pricing pressure and Pre-Roll scale anchor growth.
The mix shift implies a deliberate pivot toward value-forward Pre-Roll volume and opportunistic Flower recovery, as the 3.80% Pre-Roll month-over-month gain paired with a 118.20% Flower month-over-month surge suggests tactical replenishment rather than a structural swing from the 82.69%/17.31% split. Holding rank 23 in Pre-Roll while cutting average prices 21.97% year over year points to positioning around accessible price tiers and multi-pack formats, with the 45.43% Pre-Roll year-over-year growth outpacing the 13.50% brand-level growth, implying that incremental share accrues where price elasticity is highest and that future differentiation will hinge on sustaining Pre-Roll velocity while selectively rebuilding Flower without diluting margin further.
Competitive Landscape
Choklit Park sits at rank #23 in BC Pre-Roll for June 2026, improving 3 positions year over year from #26 and 5 positions versus March 2026’s #28, yet still far from its October 2025 peak of #7; meanwhile, General Admission held #1 with an 18.9% YoY sales decline and Back Forty / Back 40 Cannabis climbed from #22 to #3 on 263.3% YoY sales growth, indicating that Choklit Park’s modest rank gains amid both top-end contraction and aggressive mid-pack ascension imply a stabilization phase rather than a return to prior top-10 standing without additional share capture.
Notable Products
Lamb's Bread Pre-Roll 5-Pack (2.5g) posted the largest movement in June 2026 with +186.6% MoM, leaping into rank 8, while Blueberry Yum Yum Pre-Roll 3-Pack (3g) slid -29.7% to rank 10; this mix signals volatility at the lower ranks driving incremental share shifts rather than top-line dependence. At the top, Hawaiian Snow Pre-Roll 10-Pack (5g) held rank 1 with +3.7% MoM and Moon Puppies Pre-Roll 10-Pack (5g) stayed at rank 2 with +1.1% MoM, while Royal Caramel Pre-Roll 10-Pack (5g) fell -27.1% at rank 3; the split between steady leaders and a sharp mid-tier decline implies consumer rotation within the 10-pack format. Four of the top ten are Pre-Roll multi-packs concentrated in 10-pack and 5-pack formats, and Flawless Victory Pre-Roll 3-Pack (1.5g) surged +60.6% to rank 5 with approximately $20,769, indicating growth gravitating to value-sized SKUs as shoppers trade into multipack convenience.
Top Selling Cannabis Brands
Data for this report comes from real-time sales reporting by participating cannabis retailers via their point-of-sale systems, which are linked up with Headset’s business intelligence software. Headset’s data is very reliable, as it comes digitally direct from our partner retailers. However, the potential does exist for misreporting in the instance of duplicates, incorrectly classified products, inaccurate entry of products into point-of-sale systems, or even simple human error at the point of purchase. Thus, there is a slight margin of error to consider. Brands listed on this page are ranked in the top twenty within the market and product category by total retail sales volume.

