.svg)
Sep-2026
Sales
Trend
6-Month
Product Count
SKUs
Avg Price
YoY Sales Change
YoY Price Change


Market Insights Snapshot
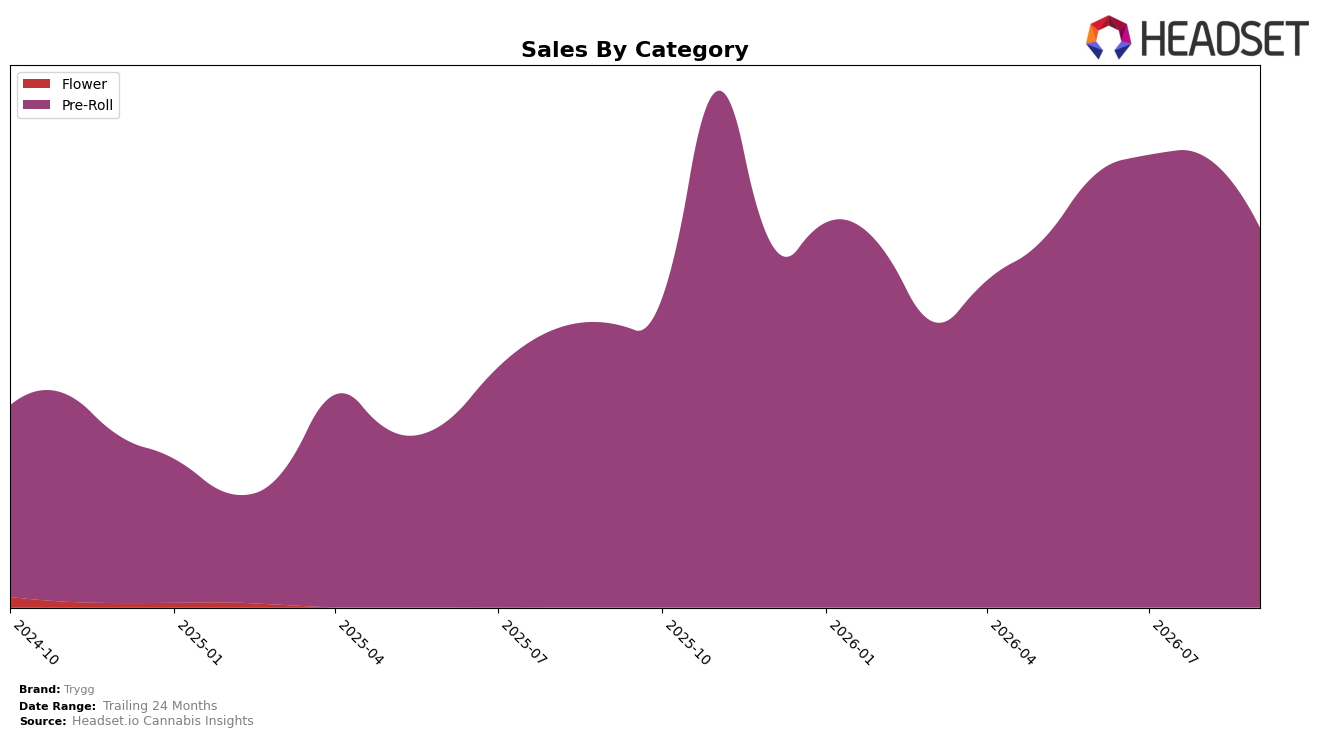
In September 2026, Trygg’s mix was concentrated in Pre-Roll at 100.0% share, with year-over-year sales up 33.6% while month-over-month sales declined 15.8%. Average price sat at $26.69, with a 1.0% YoY decrease and no offsetting category diversification, and the brand held rank 35 in Pre-Roll within British Columbia. The combination of a double-digit YoY gain alongside a double-digit MoM pullback implies the brand is leveraged to single-category momentum but exposed to short-cycle volatility when Pre-Roll demand softens.
The single-category focus indicates positioning anchored to Pre-Roll value and volume, with a 1.0% YoY price contraction paired with 33.6% YoY sales growth suggesting unit-led expansion rather than price-led gains. Sitting at rank 35 in British Columbia while carrying 100.0% category dependence and a 15.8% MoM contraction implies the next share moves will come more from execution within the Pre-Roll lane than from mix shifts, pointing to a need to stabilize monthly sell-through while maintaining the unit growth that powered the YoY result.
Competitive Landscape
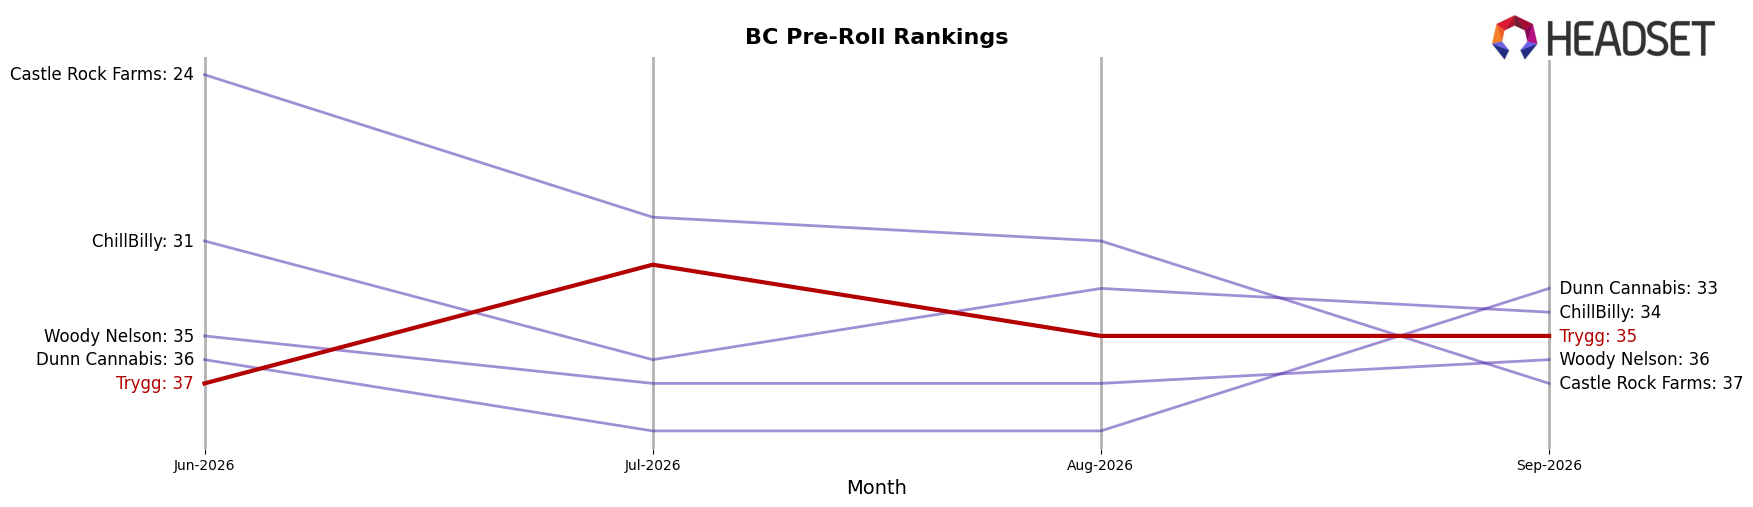
Trygg sits at rank #35 in BC Pre-Roll for September 2026, sliding 5 positions year over year from #30 and drifting 2 spots from June 2026’s #37, while still far from its peak of #9 in October 2025; meanwhile, Weed Me moved up from #2 to #1 with 28.6% YoY sales growth and Back Forty / Back 40 Cannabis climbed from #13 to #2 on 197.3% YoY growth, outpacing Trygg’s rank decline by double-digit ladder moves. With General Admission slipping from #1 to #3 despite an 8.5% YoY sales contraction and Good Supply advancing from #6 to #4 on 43.0% YoY growth, the gap between leaders consolidating top-five positions and Trygg’s descent from a prior top-10 peak indicates share is concentrating at the top while mid-pack churn increases, implying Trygg’s trajectory points to continued shelf-pressure unless it reclaims rank momentum.
Notable Products
Ignite Pre-Roll 2-Pack (2g) posted the steepest decline in September 2026, dropping 53.5% month over month while sitting at rank 4, and Block Party Variety Pack Pre-Roll 10-Pack (5g) fell 57.7% at rank 9, indicating pressure on smaller pack and mid-tier variants. Block Party Variety Pack Pre-Roll 20-Pack (10g) remained at rank 1 despite a 13.7% decline and $151,221 in sales, whereas Death Bubba Pre-Roll 10-Pack (4g) held rank 2 with a smaller 6.0% pullback, showing resilience at the top even as velocity softened. With all top-10 items in the Pre-Roll category and four of the top five concentrated in multi-pack formats, the mix points to reliance on bulk value that may be cannibalizing lower-count packs as price-sensitive buyers consolidate purchases.
Top Selling Cannabis Brands






Data for this report comes from real-time sales reporting by participating cannabis retailers via their point-of-sale systems, which are linked up with Headset’s business intelligence software. Headset’s data is very reliable, as it comes digitally direct from our partner retailers. However, the potential does exist for misreporting in the instance of duplicates, incorrectly classified products, inaccurate entry of products into point-of-sale systems, or even simple human error at the point of purchase. Thus, there is a slight margin of error to consider. Brands listed on this page are ranked in the top twenty within the market and product category by total retail sales volume.

