.svg)

Aug-2026
Sales
Trend
6-Month
Product Count
SKUs
Avg Price
YoY Sales Change
YoY Price Change


Where to Buy
Clear Gold Concentrates is stocked at 48 licensed dispensaries across Massachusetts, with the deepest coverage in Boston, Framingham, Haverhill, Middleborough, and New Bedford. Search by ZIP code or city below to find the closest one, or filter by product type if you are after a specific format.
Market Insights Snapshot
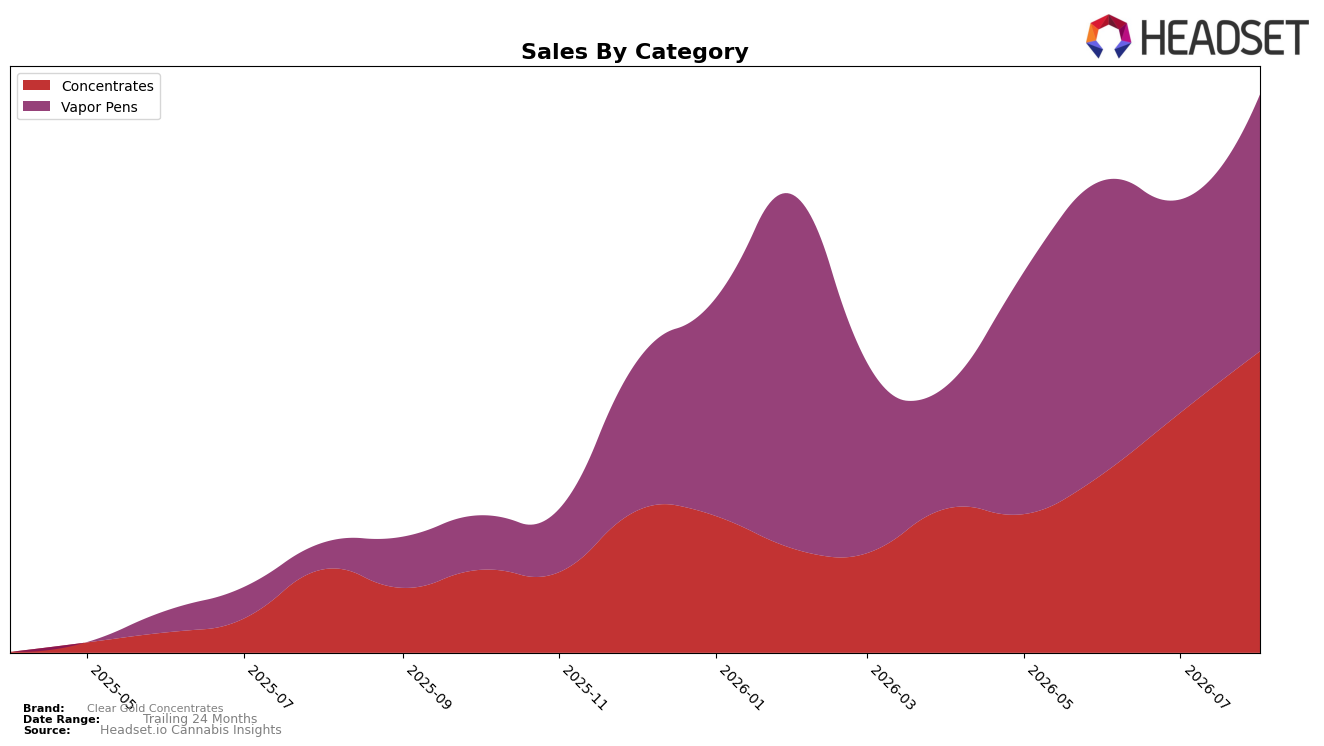
In August 2026, Clear Gold Concentrates split its revenue between Concentrates at 54.00% share and Vapor Pens at 45.99% share, with Concentrates up 262.29% year over year and 25.60% month over month, while Vapor Pens surged 869.47% year over year and 20.48% month over month. The brand’s average price rose 9.64% year over year to $23.22, with category-level price points diverging at $19.48 in Concentrates versus $29.98 in Vapor Pens, implying mix-driven margin variability as Vapor Pens expand. The pattern implies a dual-engine portfolio where the faster YoY trajectory in Vapor Pens and the larger share in Concentrates together lifted total brand sales by 408.89% year over year, setting the stage for mix-sensitive growth management.
Positioning-wise, holding the number 11 rank in Concentrates in Massachusetts alongside a 25.60% month-over-month gain in that category suggests headroom to convert share without over-relying on discounting, while the 869.47% year-over-year rise in Vapor Pens against a 20.48% month-over-month pace indicates momentum that can be tempered or accelerated via inventory and price levers. With Concentrates retaining a 54.00% anchor share and Vapor Pens contributing a higher ticket at $29.98, the mix implies a path to climb from rank 11 by leaning on Concentrates for shelf breadth and using Vapor Pens’ higher price tier to lift revenue efficiency, especially as August 2026 mix tilts toward categories with distinct price elasticities.
Competitive Landscape
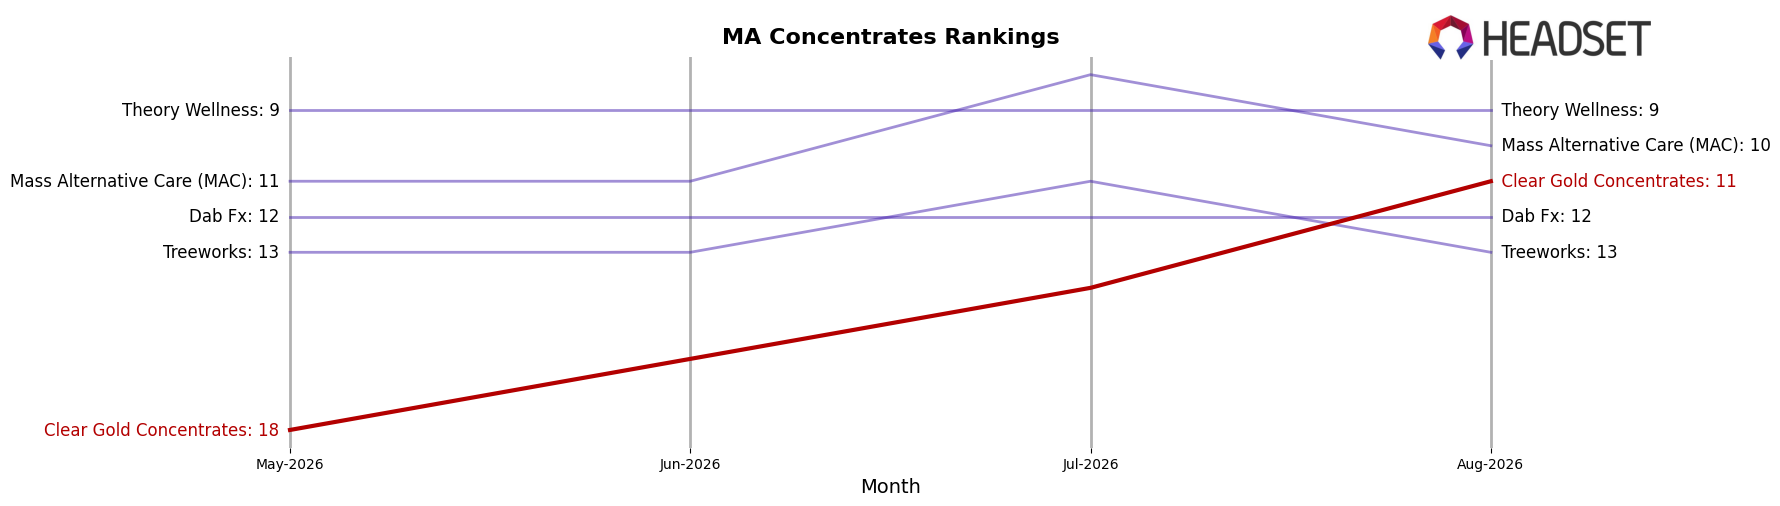
Clear Gold Concentrates is ranked #11 in MA Concentrates in August 2026, improving 20 positions year over year from #31, and rising 7 spots since May 2026 when it sat at #18; this #11 also marks its peak rank to date in August 2026. Meanwhile, Good Chemistry Nurseries held #1 with a 61.99% year-over-year sales increase while Crispy Commission Concentrates stayed at #2 with a 22.33% sales decline, and Harbor House Collective advanced from #9 to #4 with a 79.87% gain, indicating Clear Gold Concentrates’ ascent is occurring amid divergent competitor momentum. The pattern implies Clear Gold Concentrates’ rapid rank climb into the low teens, coinciding with peers either consolidating at the top or retrenching, positions it to test a top-10 entry if its three-month trajectory (+7 ranks since May 2026) persists.
Notable Products
Super Silver Haze OG Live Resin (1g) posted the largest movement in August 2026 with a +180% month-over-month surge to rank 2, while Stoopid Fruits x Cap Junky Live Resin (1g) fell -15% to rank 9, indicating volatility concentrated at both the top and tail of the lineup. Blue Dream Live Resin (1g) also jumped +103% to rank 1, and with four of the top ten belonging to the Live Resin family in Concentrates, the brand’s momentum is anchored in a narrow set of terpene-forward SKUs rather than spread across formats. Vapor Pens placed at ranks 5, 8, and 10 with no MoM gains reported, and the leading pen, Acapulco Gold Liquid Diamonds Distillate Cartridge (1g), generated $9.8k but trailed the two highest-ranking Live Resin SKUs, pointing to a format skew favoring dabbable products over inhalable cartridges. Together, the rank shifts and MoM dispersion imply Clear Gold Concentrates is tilting its commercial mix toward high-velocity Live Resin while accepting volatility on experimental strains and deprioritizing pen-led expansion.
Top Selling Cannabis Brands






Data for this report comes from real-time sales reporting by participating cannabis retailers via their point-of-sale systems, which are linked up with Headset’s business intelligence software. Headset’s data is very reliable, as it comes digitally direct from our partner retailers. However, the potential does exist for misreporting in the instance of duplicates, incorrectly classified products, inaccurate entry of products into point-of-sale systems, or even simple human error at the point of purchase. Thus, there is a slight margin of error to consider. Brands listed on this page are ranked in the top twenty within the market and product category by total retail sales volume.

