Market Insights Snapshot
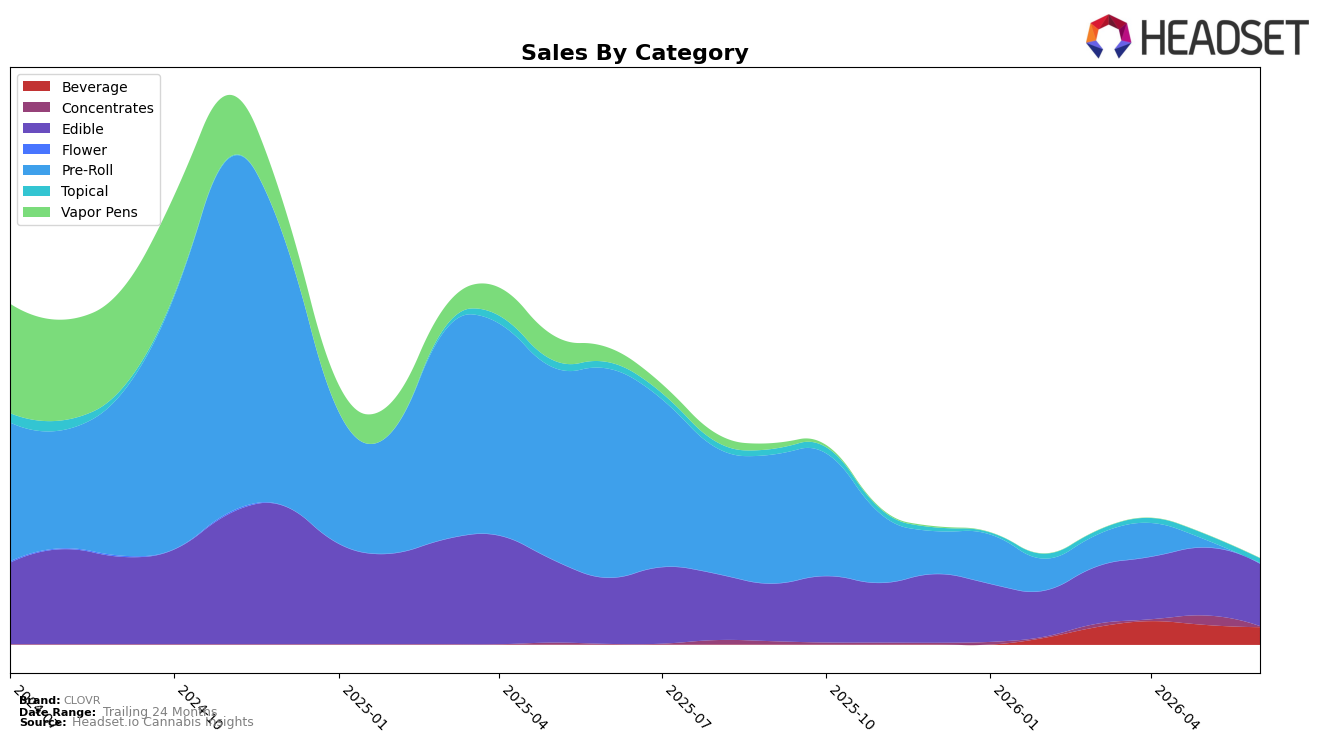
In June 2026, CLOVR’s mix is concentrated in Edible at 73.16% share with year-over-year decline of 5.70% and month-over-month decline of 8.18%, while Beverage holds 20.56% share with a 11.67% month-over-month drop and no year-over-year read, and Topical sits at 5.08% share with year-over-year down 30.07% and month-over-month down 17.54%. Minor lines whipsawed: Concentrates shows a 128.89% year-over-year change but a 91.92% month-over-month fall, and Pre-Roll is down 99.86% year-over-year and 96.29% month-over-month, indicating near-exit scale. With overall brand sales down 71.30% year-over-year and an average price down 5.24%, the pattern implies CLOVR is over-indexed to Edible in Missouri while secondary categories are shrinking too quickly to offset Edible’s incremental declines.
The mix shift suggests positioning risk: reliance on a single anchor category coincides with a state-category rank of 40 in Edible, and the 8.18% month-over-month Edible drop outpaces the Beverage 11.67% month-over-month fall only slightly while Topical’s 17.54% month-over-month drop drags breadth. With Concentrates collapsing 91.92% month-over-month after a 128.89% year-over-year jump and Pre-Roll contracting 96.29% month-over-month alongside a 99.86% year-over-year fall, the portfolio is shedding trial formats rather than cultivating trade-up paths, implying CLOVR’s current pricing (average $16.65) and assortment are reinforcing a narrow Edible-led identity that limits rank mobility and resilience across Missouri.
Competitive Landscape
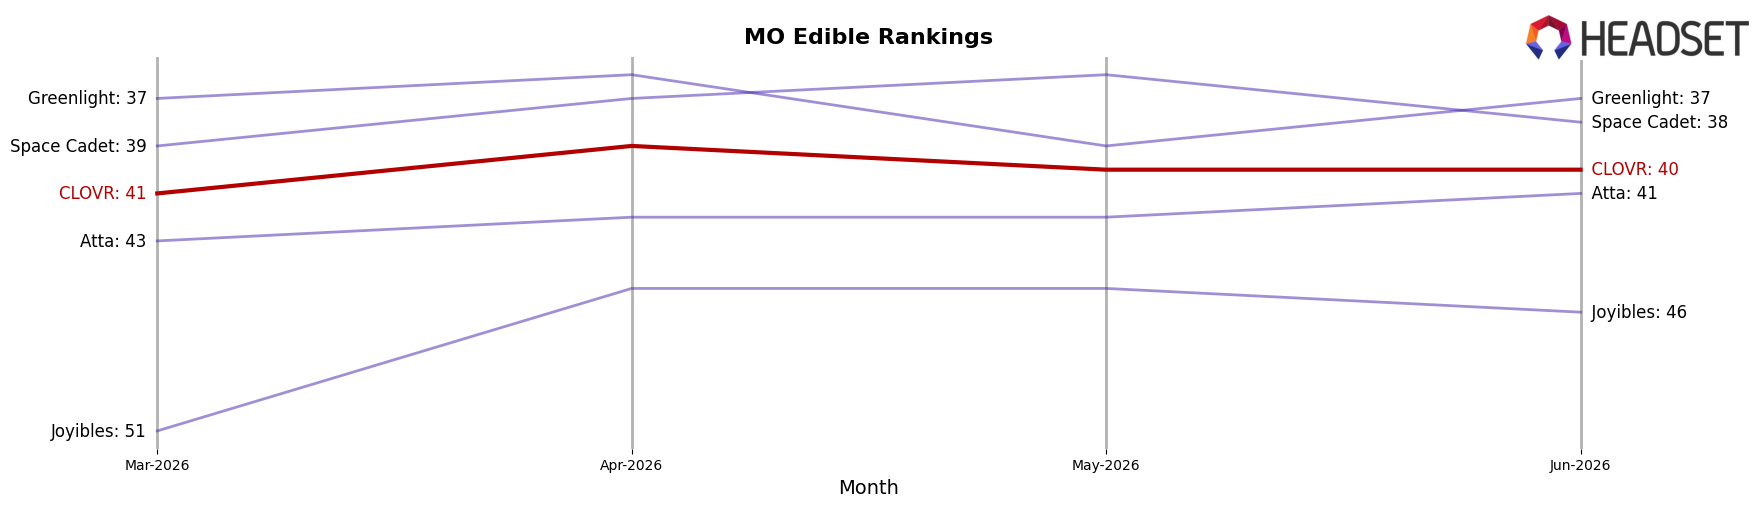
CLOVR sits at rank #40 in Missouri Edible for June 2026, unchanged from #40 year over year, while edging up 1 position from #41 in March 2026; this stability contrasts with Good Day Farm rising from #4 to #2 and Smokiez Edibles sliding from #2 to #5. Despite a historical peak at #29 in September 2024, the current placement at #40 and a flat YoY rank suggest limited share recovery relative to leaders, as Gron / Grön holds #1 with a -13.1% YoY sales change and Wyld remains steady at #3 with a -2.2% YoY sales change; the pattern implies CLOVR’s rank trajectory is stagnating at the lower end of the top 50, indicating that incremental gains will likely require displacement of peers experiencing mixed momentum.
Notable Products
Watermelon Sucker (25mg) delivered the standout move in June 2026 with a 55.6% month-over-month surge to rank 1, while CBD/THC/CBG 1:1:1 Mocha Milk Chocolate Bar 10-Pack (100mg CBD, 100mg THC, 100mg CBG) slid 27.0% to rank 4. Cookie Butter Milk Chocolate Bar 10-Pack (100mg) fell 32.3% at rank 5, and 72% Venezuelan Dark Chocolate Bar 10-Pack (100mg) declined 25.0% at rank 8, indicating that three chocolate SKUs inside the top ten are contracting together. Tickled Pink Shot (100mg THC, 2oz, 60ml) grew 19.8% at rank 3 as Summa Time Shot (100mg THC, 2oz, 60ml) entered at rank 6, suggesting beverages are filling some of the demand gap left by softer chocolate bars. The pattern implies CLOVR’s mix is tilting toward single-serve novelty and beverages as chocolate-led multi-pack formats cede share, pointing to a near-term focus on portable dosing and flavor-led rotation over traditional bar depth.
Top Selling Cannabis Brands
Data for this report comes from real-time sales reporting by participating cannabis retailers via their point-of-sale systems, which are linked up with Headset’s business intelligence software. Headset’s data is very reliable, as it comes digitally direct from our partner retailers. However, the potential does exist for misreporting in the instance of duplicates, incorrectly classified products, inaccurate entry of products into point-of-sale systems, or even simple human error at the point of purchase. Thus, there is a slight margin of error to consider. Brands listed on this page are ranked in the top twenty within the market and product category by total retail sales volume.

