.svg)


Where to Buy
Sweet Talk is stocked at 47 licensed dispensaries across Maryland and Ohio, 41 of them in Maryland, with the deepest coverage in Baltimore, Annapolis, Hagerstown, Upper Marlboro, and Aberdeen. Search by ZIP code or city below to find the closest one.
Market Insights Snapshot
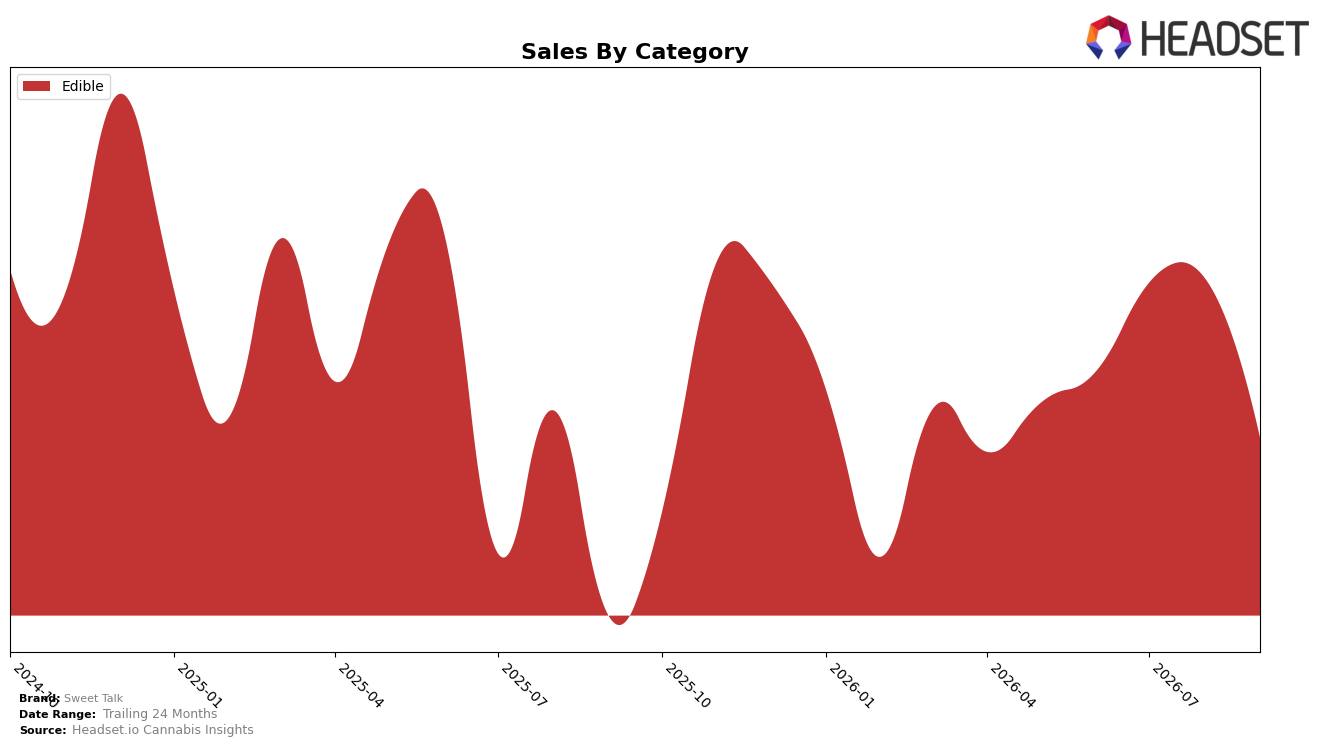
In September 2026, Sweet Talk operated as a single-category brand with Edible accounting for 100.0% of sales, while the brand’s overall year-over-year sales rose 44.31% and month-over-month sales within Edible fell 21.63%. The average price declined 9.69% year over year to $18.48, and Sweet Talk held rank 29 within Edible in Maryland, indicating a mid-pack position despite the single-category concentration. The pattern implies that Sweet Talk is trading lower pricing for higher annual volume in Edible, but the negative month-over-month swing and a rank of 29 suggest vulnerability to intra-category volatility without diversification.
The mix shift being entirely Edible at 100.0% alongside a 44.31% year-over-year lift and a 21.63% month-over-month drop indicates sensitivity to short-cycle demand, with price elasticity likely aiding annual gains as average price fell 9.69%. Holding only rank 29 in Maryland for Edible while relying 100.0% on that category points to limited insulation from seasonal or promotional troughs, and the -7.11% two-year sales change signals that recent growth may be recovery rather than expansion. The pattern implies Sweet Talk’s positioning is anchored in value-driven Edibles, where sustained share gains will require either improving rank from 29 through mix tiering or expanding beyond a 100.0% Edible dependency to smooth month-over-month shocks.
Competitive Landscape
Sweet Talk is ranked #29 in MD Edible for September 2026, sliding 4 positions from #25 year over year and down 3 spots from #26 in June 2026, while still sitting 7 places below its peak of #22 from June 2025; in contrast, Incredibles climbed from #5 to #1 with a 58.1% year-over-year sales increase, and Wyld dipped from #1 to #4 alongside a 32.9% sales decline, indicating that Sweet Talk’s downward drift amid volatile leader movements suggests erosion of relative competitiveness rather than a broad market downdraft.

Notable Products
Blue Raspberry Gummies 10-Pack (100mg) posted the steepest decline in September 2026 at -47.6% MoM while dropping behind higher-ranked peers at rank 5, and Sativa Orange Peach Nano Gummies 10-Pack (100mg) also contracted by -17.6% at rank 4. In contrast, Watermelon Gummies 10-Pack (100mg) jumped 35.9% MoM to rank 2 and Guava Passionfruit Gummies 10-Pack (100mg) added 9.8% MoM while holding rank 1, with total dollar concentration still led by the top two SKUs around $26,000 combined. With all top-10 items in Edible and eight of the ten being 10-Pack formats, the mix points to Sweet Talk consolidating around core 10-Pack fruit SKUs while nano and 20-Pack variants retrench.
Top Selling Cannabis Brands






Data for this report comes from real-time sales reporting by participating cannabis retailers via their point-of-sale systems, which are linked up with Headset’s business intelligence software. Headset’s data is very reliable, as it comes digitally direct from our partner retailers. However, the potential does exist for misreporting in the instance of duplicates, incorrectly classified products, inaccurate entry of products into point-of-sale systems, or even simple human error at the point of purchase. Thus, there is a slight margin of error to consider. Brands listed on this page are ranked in the top twenty within the market and product category by total retail sales volume.

