May-2026
Sales
Trend
6-Month
Product Count
SKUs
Avg Price
YoY Sales Change
YoY Price Change
Market Insights Snapshot
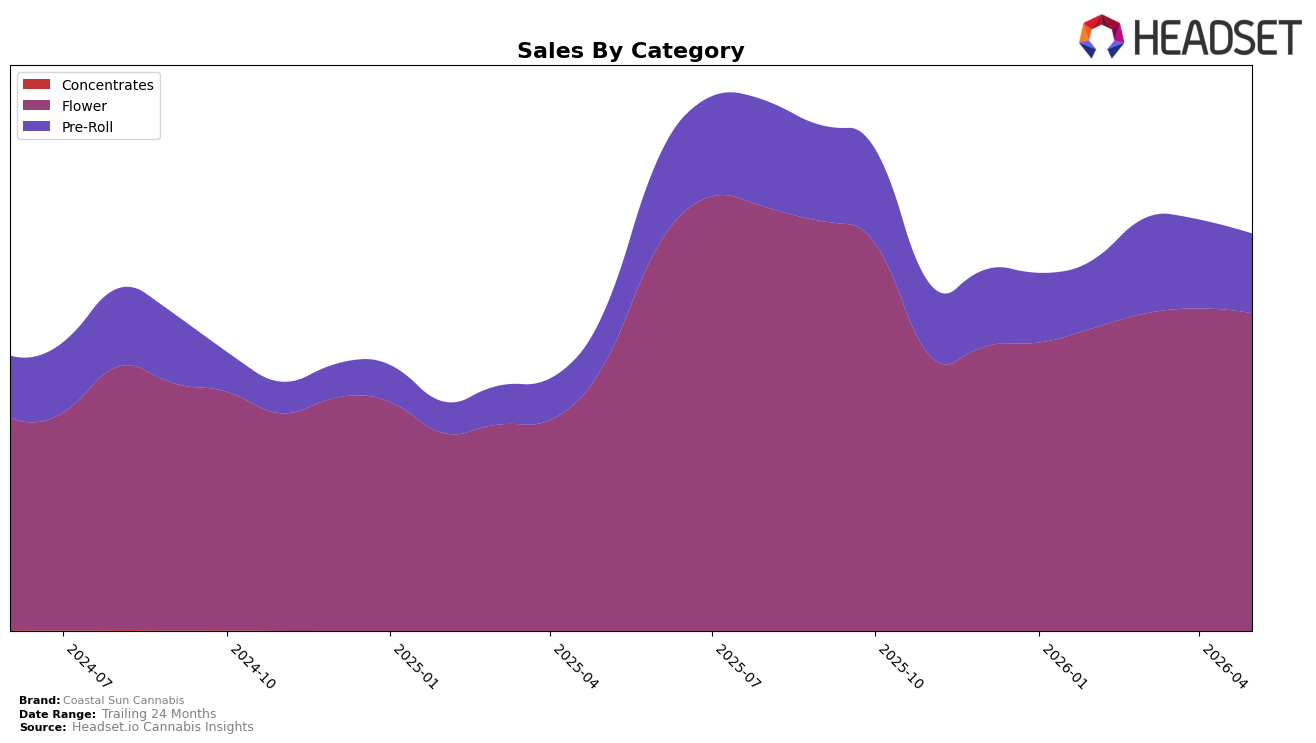
In May 2026, Coastal Sun Cannabis concentrated 79.97% of sales in Flower with a 19.70% year-over-year lift but a 1.51% month-over-month dip, while Pre-Roll held 20.03% share with a 52.56% year-over-year gain and a 10.32% month-over-month decline; the average brand price rose 6.59% year over year to $26.20. Within California Flower, the brand sat at rank 11, indicating depth in its lead category even as short-term volume softened; the mix suggests reliance on Flower for scale alongside faster YoY traction in Pre-Roll, implying a portfolio skew that is expanding but still anchored by a single pillar.
The combination of a 19.70% YoY increase in Flower against a 52.56% YoY surge in Pre-Roll, paired with simultaneous MoM pullbacks of 1.51% and 10.32% respectively, points to elasticity around price and promotional cadence rather than a demand reset, particularly with the brand’s overall sales up 25.10% year over year and a Flower rank of 11 in California. This pattern implies Coastal Sun Cannabis can convert Pre-Roll’s higher growth into share only if volatility is managed, while the Flower-heavy 79.97% mix provides stability but caps diversification, suggesting near-term positioning that leverages Flower scale to buffer Pre-Roll swings while testing price-pack architecture as average price climbs 6.59%.
Competitive Landscape
Coastal Sun Cannabis sits at rank #11 in CA Flower for May 2026, improving 8 positions from #19 year over year, while holding flat versus February 2026 at #11; this contrasts with CAM climbing from #4 to #1 alongside a 46.88% YoY sales gain and STIIIZY holding #2 with a 39.68% YoY increase. Despite a historical peak of #6 in September 2025, the brand’s current placement at #11 versus competitors at #1 and #2 indicates share consolidation above it and suggests that maintaining low double‑digit rank will require either a move back toward top‑10 by 1–2 positions or ceding ground to faster‑rising leaders.

Notable Products
Banjo Pre-Roll 10-Pack (3.5g) posted the steepest decline in May 2026 at -60.5% MoM while sliding to rank 6, and Jelly Cake (7g) also contracted -25.9% MoM while holding rank 5. In contrast, GMO Garlic Cookies (3.5g) advanced +30.0% MoM to rank 2, and Banjo (3.5g) grew +14.9% to hold rank 1. With five of the top ten coming from Pre-Roll 10-Pack formats, yet the sharpest contraction centered in that format while Flower SKUs like Strawnana Mac (7g) climbed +21.4% at rank 4, the mix implies a pivot toward higher-velocity flower while pre-rolls require SKU-level pruning despite $87,019 posted by Banjo (14g) at rank 8.
Top Selling Cannabis Brands
Data for this report comes from real-time sales reporting by participating cannabis retailers via their point-of-sale systems, which are linked up with Headset’s business intelligence software. Headset’s data is very reliable, as it comes digitally direct from our partner retailers. However, the potential does exist for misreporting in the instance of duplicates, incorrectly classified products, inaccurate entry of products into point-of-sale systems, or even simple human error at the point of purchase. Thus, there is a slight margin of error to consider. Brands listed on this page are ranked in the top twenty within the market and product category by total retail sales volume.

