.svg)

Aug-2026
Sales
Trend
6-Month
Product Count
SKUs
Avg Price
YoY Sales Change
YoY Price Change


Where to Buy
Alien Labs is stocked at 587 licensed dispensaries across California, Arizona, and 2 other states, 418 of them in California, with the deepest coverage in Los Angeles, Sacramento, San Diego, San Francisco, and San Jose. Search by ZIP code or city below to find the closest one, or filter by product type if you are after a specific format.
Market Insights Snapshot
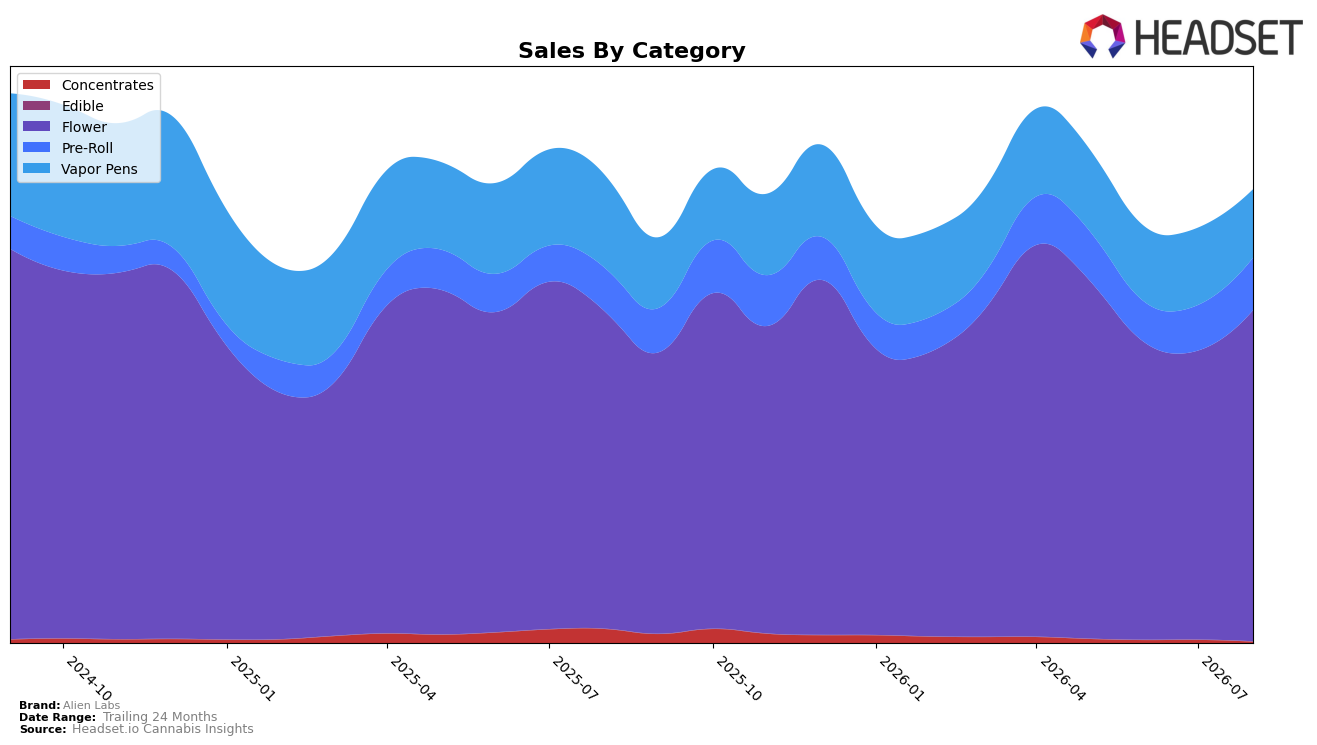
Alien Labs concentrated 73.22% of August 2026 sales in Flower with year-over-year growth of 4.35% and month-over-month growth of 14.73%, while Pre-Roll at 11.53% share advanced 20.94% YoY and 15.22% MoM. Vapor Pens, now 15.04% share, declined 26.69% YoY and 11.66% MoM, and Concentrates fell to 0.22% share with a 92.82% YoY drop and a 64.53% MoM decline. Despite overall brand sales down 3.14% YoY and average price up 5.99% YoY to $29.35, the category mix indicates a pivot toward Flower and Pre-Roll volume that offsets weakness in Vapor Pens and Concentrates.
With Flower ranked 12 in California and posting a 14.73% MoM gain alongside Pre-Roll’s 15.22% MoM increase, Alien Labs is leaning into inhalable combustion formats as its primary shelf strategy while de-prioritizing Concentrates, which fell 92.82% YoY, and conceding share in Vapor Pens with a 26.69% YoY slide. The pattern—Flower at 73.22% mix and Vapor Pens at 15.04%—implies merchandising and product development are aligned to defend mid-tier Flower rank positioning and use Pre-Roll as an entry-price or trial lever, accepting reduced presence in oil-based formats.
Competitive Landscape
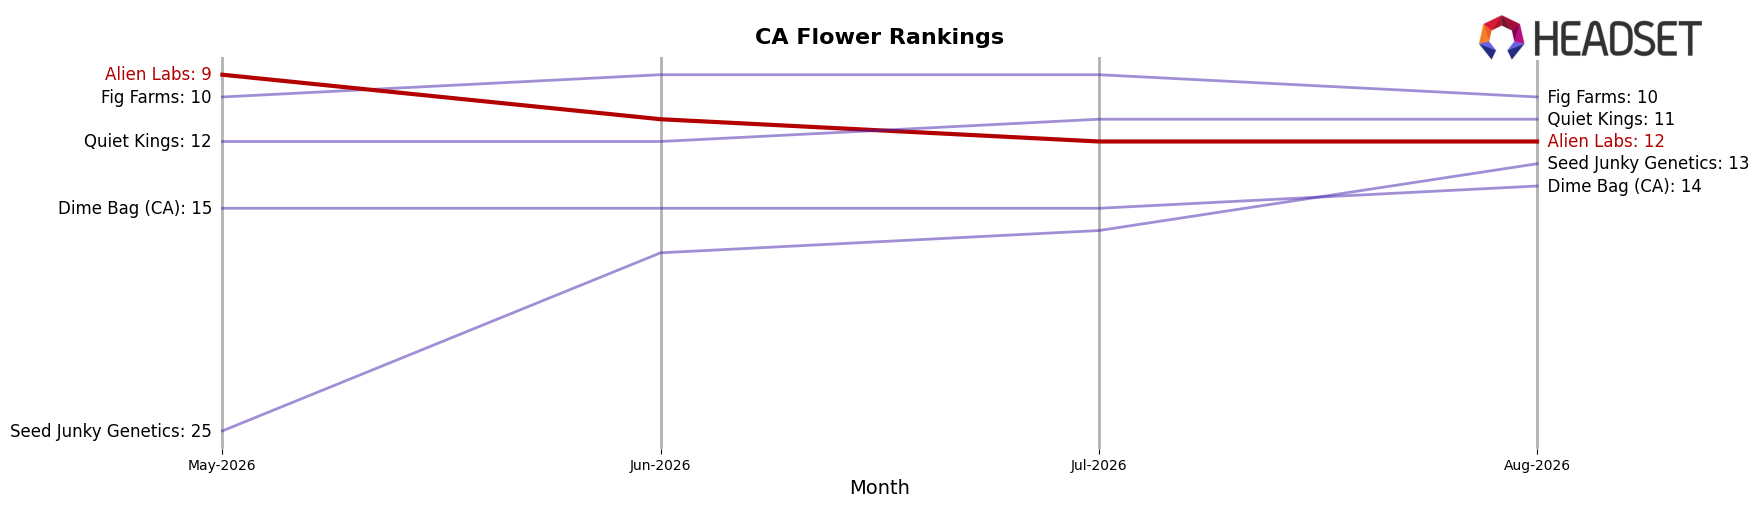
Alien Labs sits at rank #12 in California Flower in August 2026, down 5 spots year over year from #7, and 3 spots below its May 2026 position of #9, while still trailing its peak of #3 from September 2024; in contrast, STIIIZY moved up from #2 to #1 and expanded sales by 50.99%, and Oakfruitland jumped from #14 to #5 with an 80.47% sales increase, indicating Alien Labs has lost relative share to faster risers. Compared with CAM, which climbed from #3 to #2 with a 46.07% gain, Alien Labs’ slide from #9 to #12 over three months and from #7 to #12 year over year points to distribution or velocity headwinds versus top-tier competitors; the pattern implies Alien Labs’ rank trajectory is drifting from leadership contention toward mid-tier status unless it reclaims monthly momentum and narrows the gap to the top 5.
Notable Products
Atomic Apple Pre-Roll (1g) posted the standout move in August 2026 with an 84.3% month-over-month surge and entered the top 10 at rank 6, while Brain Wash Pre-Roll (1g) also jumped 55.6% to rank 8. In contrast, XJ-13 (3.5g) held rank 1 despite a 5.8% decline, and Bk Satellite (3.5g) climbed to rank 2 on a 40.0% gain. With four of the top ten coming from Pre-Roll, the category’s acceleration against mostly stable Flower ranks signals a pivot toward value-per-serving formats that can scale quickly.
Atomic Apple (3.5g) advanced 24.1% to rank 5 and Brain Wash (3.5g) rose 20.0% to rank 7, while Permanent Shade (3.5g) inched up 1.9% at rank 3. Biskante (3.5g) grew 12.7% to rank 9, whereas the absence of double-digit declines among Flower contrasts with two Pre-Roll entries newly monetizing $53,807 and above. The mix of double-digit Flower growth alongside faster Pre-Roll velocity implies Alien Labs is broadening demand by extending core strains into adjacent formats.
Top Selling Cannabis Brands






Data for this report comes from real-time sales reporting by participating cannabis retailers via their point-of-sale systems, which are linked up with Headset’s business intelligence software. Headset’s data is very reliable, as it comes digitally direct from our partner retailers. However, the potential does exist for misreporting in the instance of duplicates, incorrectly classified products, inaccurate entry of products into point-of-sale systems, or even simple human error at the point of purchase. Thus, there is a slight margin of error to consider. Brands listed on this page are ranked in the top twenty within the market and product category by total retail sales volume.

