Feb-2026
Sales
Trend
6-Month
Product Count
SKUs
Avg Price
YoY Sales Change
YoY Price Change
Market Insights Snapshot
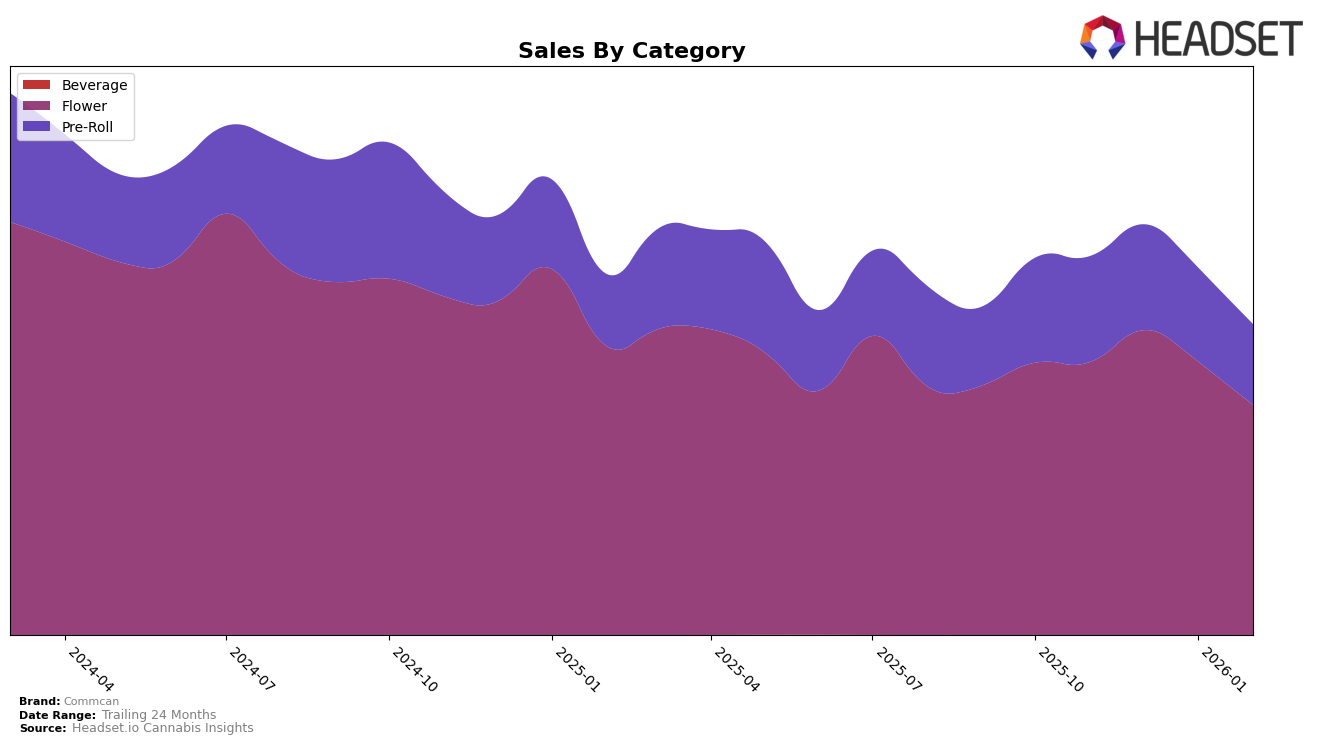
Commcan's performance in the Massachusetts market reveals a nuanced trajectory across different product categories. In the Flower category, Commcan maintained a presence within the top 30 brands throughout the observed months, with a slight dip from 23rd in December 2025 to 27th by February 2026. This downward movement indicates some challenges in sustaining momentum despite a notable increase in sales during December. Meanwhile, in the Pre-Roll category, Commcan did not feature in the top 30 rankings, highlighting a potential area for growth or reevaluation of strategy in this segment, especially given the declining sales from November to February.
While Commcan's consistent presence in the Flower category rankings is commendable, the absence from the top 30 in Pre-Rolls across the months suggests a competitive landscape or possible strategic misalignment in this sector. The fluctuations in rankings for Flower could be attributed to seasonal demand variations or increased competition, which may require Commcan to enhance its market strategies to maintain or improve its standing. The performance in Massachusetts reflects broader trends that could inform future decisions, especially in optimizing product offerings and marketing efforts to capture a larger market share.
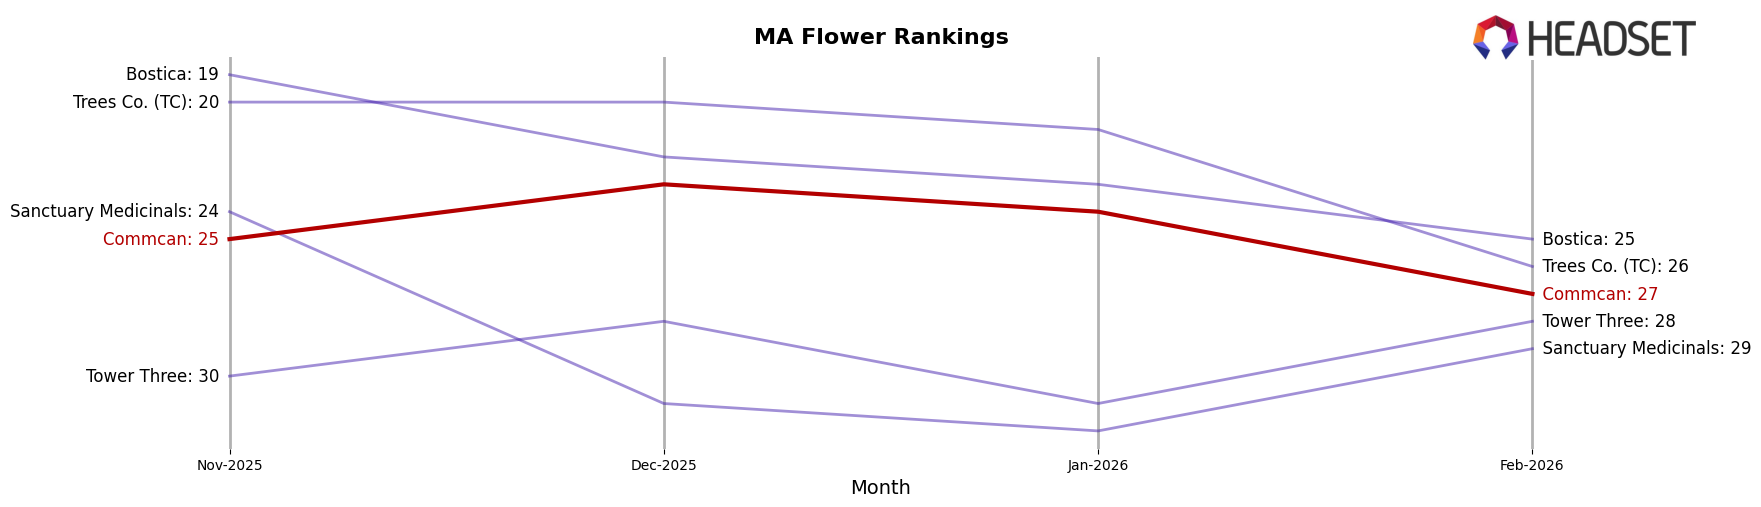
Competitive Landscape
In the Massachusetts flower category, Commcan has shown a fluctuating performance in terms of rank and sales over the recent months. While Commcan improved its rank from 25th in November 2025 to 23rd in December 2025, it experienced a slight decline to 27th by February 2026. Despite this, Commcan's sales in December 2025 were notably higher than in other months, indicating a potential seasonal boost or successful marketing campaign. In comparison, Trees Co. (TC) consistently maintained a stronger position, ranking within the top 20 until February 2026 when it dropped to 26th, suggesting a potential opportunity for Commcan to capitalize on any weaknesses. Meanwhile, Bostica and Sanctuary Medicinals also showed varying ranks, with Bostica maintaining a higher rank than Commcan throughout the period, although it too saw a decline by February 2026. This competitive landscape highlights the dynamic nature of the Massachusetts flower market and underscores the importance for Commcan to leverage strategic initiatives to improve its standing and capture greater market share.
Notable Products
In February 2026, GMO Pre-Roll (1g) maintained its position as the top-selling product for Commcan, with sales of 2,741 units. Sour Diesel Pre-Roll (1g) climbed to the second rank, showing a significant increase from its third position in January 2026 with 2,486 units sold. J1 Pre-Roll (1g) maintained its third-place ranking from January 2026, indicating consistent performance. Amaretto Mintz (3.5g) entered the rankings at fourth place, while Daily Special Pre-Roll (1g) held steady at fifth place, mirroring its January 2026 ranking. These movements highlight a dynamic shift in consumer preferences, with notable gains for Sour Diesel Pre-Roll (1g) and the introduction of Amaretto Mintz (3.5g) to the top ranks.
Top Selling Cannabis Brands
Data for this report comes from real-time sales reporting by participating cannabis retailers via their point-of-sale systems, which are linked up with Headset’s business intelligence software. Headset’s data is very reliable, as it comes digitally direct from our partner retailers. However, the potential does exist for misreporting in the instance of duplicates, incorrectly classified products, inaccurate entry of products into point-of-sale systems, or even simple human error at the point of purchase. Thus, there is a slight margin of error to consider. Brands listed on this page are ranked in the top twenty within the market and product category by total retail sales volume.

