Jul-2025
Sales
Trend
6-Month
Product Count
SKUs
Avg Price
YoY Sales Change
YoY Price Change
Market Insights Snapshot
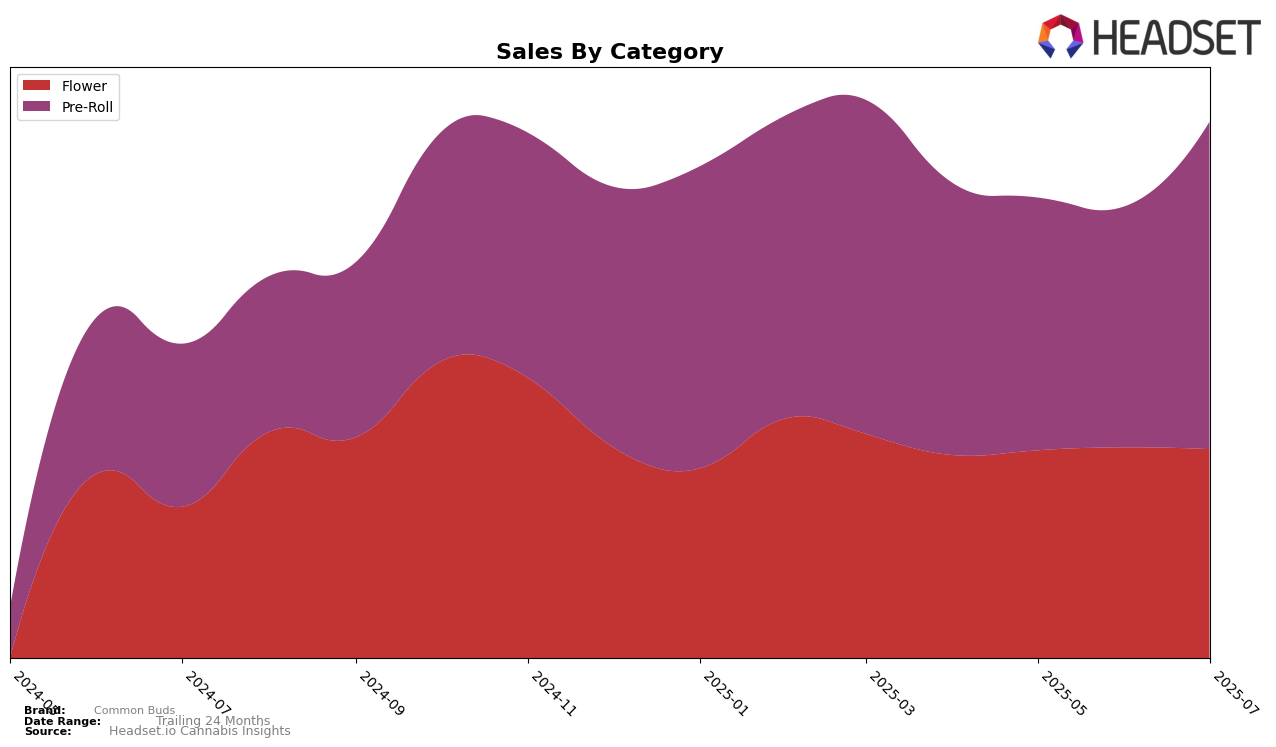
In the state of Massachusetts, Common Buds has demonstrated a consistent presence in the Flower category, although not making it into the top 30 brands. Over the months from April to July 2025, their rank hovered around the mid-60s, indicating a stable yet non-dominant position in the market. The sales figures show a slight upward trend from April to June, with a small dip in July. This suggests that while Common Buds maintains a steady flow of sales, breaking into a more competitive position remains a challenge for this category.
Conversely, in the Pre-Roll category, Common Buds has shown more dynamic movement within the top 30 brands in Massachusetts. They fluctuated between ranks 28 and 35 from April to July 2025, with a notable leap to 28th place in July. This upward movement is coupled with a significant increase in sales during the same month, indicating a potential growth opportunity in this category. The ability to climb the ranks in Pre-Roll suggests that Common Buds may have a stronger foothold in this category compared to Flower, and the brand's strategic focus might benefit from capitalizing on this momentum.
Competitive Landscape
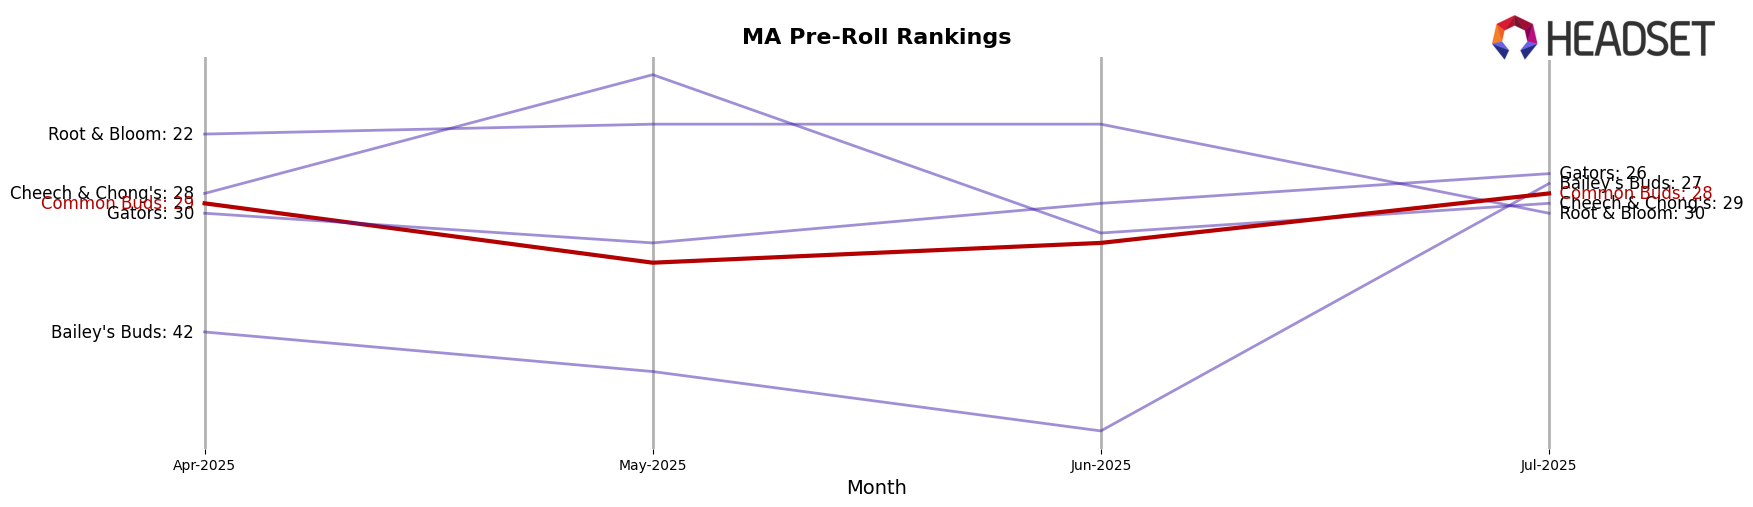
In the Massachusetts pre-roll category, Common Buds has shown a fluctuating performance in terms of rank over the past few months, but with a promising upward trend in July 2025. Starting at 29th place in April, Common Buds experienced a dip to 35th in May and 33rd in June, before climbing back to 28th in July. This improvement in rank coincides with a notable increase in sales, suggesting a positive reception to recent marketing or product changes. In contrast, Cheech & Chong's and Root & Bloom have shown more volatility, with Cheech & Chong's dropping out of the top 20 in June and July, and Root & Bloom slipping from a consistent 21st place to 30th in July. Meanwhile, Gators has steadily improved its rank, reaching 26th in July, which may pose a competitive threat. The resurgence in Common Buds' sales and rank in July indicates a potential for continued growth if this momentum is maintained, especially as competitors face their own challenges.
Notable Products
In July 2025, Common Buds saw London Pound Cake 75 Pre-Roll (1g) rise to the top as the best-selling product, with sales reaching 4,104 units. Specimen X Pre-Roll (1g) secured the second position, followed by Wingsuit Pre-Roll (1g) in third place. Cherry Mocha Latte Pre-Roll (1g) and Red Velvet Pre-Roll (1g) took the fourth and fifth spots, respectively. Notably, London Pound Cake 75 Pre-Roll (1g) improved from a fifth-place ranking in June to first in July, showcasing a significant boost in popularity. The other products maintained their position as they entered the rankings in July, indicating a fresh surge in sales for these pre-rolls.
Top Selling Cannabis Brands
Data for this report comes from real-time sales reporting by participating cannabis retailers via their point-of-sale systems, which are linked up with Headset’s business intelligence software. Headset’s data is very reliable, as it comes digitally direct from our partner retailers. However, the potential does exist for misreporting in the instance of duplicates, incorrectly classified products, inaccurate entry of products into point-of-sale systems, or even simple human error at the point of purchase. Thus, there is a slight margin of error to consider. Brands listed on this page are ranked in the top twenty within the market and product category by total retail sales volume.

