.svg)

Sep-2026
Sales
Trend
6-Month
Product Count
SKUs
Avg Price
YoY Sales Change
YoY Price Change


Where to Buy
Root & Bloom is stocked at 86 licensed dispensaries across Massachusetts, with the deepest coverage in Boston, Fall River, Northampton, Brockton, and Framingham. Search by ZIP code or city below to find the closest one, or filter by product type if you are after a specific format.
Market Insights Snapshot
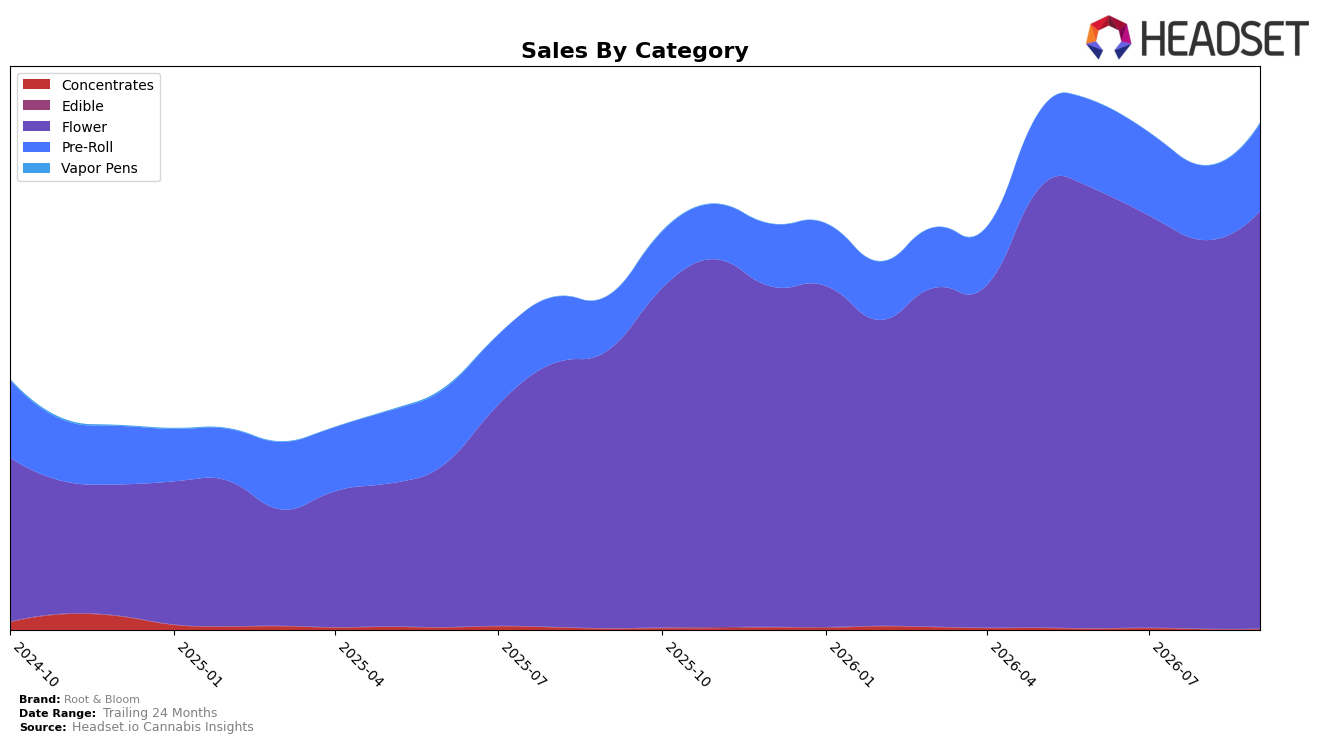
Root & Bloom’s mix in September 2026 is concentrated in Flower at 82.52% share with year-over-year growth of 50.14% and month-over-month growth of 7.41%, while Pre-Roll holds 17.22% share with 60.67% year-over-year growth and 17.33% month-over-month growth; together these two categories account for 99.74% of sales, indicating limited diversification. Vapor Pens, at 0.18% share, posted a 1,156.30% month-over-month surge but from a low base, whereas Concentrates sit at 0.08% share with a -53.22% year-over-year decline despite a 17.00% month-over-month lift; the mix supports a September 2026 brand sales year-over-year increase of 51.85% alongside a 15.18% year-over-year increase in average price. The pattern implies a Flower-led scale story with Pre-Roll acceleration contributing incremental volume, while marginal gains in Vapor Pens and ongoing weakness in Concentrates do not yet alter dependency on the core categories.
With Flower ranking 5th in the category in Massachusetts and carrying 82.52% share of brand sales, Root & Bloom is positioned as a Flower-first operator that is trading up on mix as average price rose 15.18% year-over-year while sales grew 51.85%. The 17.33% month-over-month lift in Pre-Roll versus 7.41% in Flower suggests a pipeline for near-term share capture within value-accessible formats, while the 1,156.30% month-over-month spike in Vapor Pens alongside a -53.22% year-over-year decline in Concentrates indicates early experimentation rather than a committed diversification shift. This implies the brand’s competitive posture is anchored in premiumized Flower and expanding Pre-Roll presence, with limited risk hedge from inhalable adjacencies until Vapor Pens sustain share above 1% or Concentrates reverse year-over-year contraction.
Competitive Landscape
Root & Bloom sits at rank #5 in MA Flower in September 2026, improving 1 position from #6 year over year while holding flat versus June 2026 at #5, indicating stability at its peak rank of #5 in September 2026 and limited short-term upward mobility. In contrast, Perpetual Harvest climbed from #4 to #1 with 124.12% YoY sales growth, and High Supply / Supply slipped from #3 to #4 alongside a -13.62% YoY sales decline, while Simply Herb fell from #1 to #3 with -16.59% YoY sales. The mix of a 1-rank YoY gain for Root & Bloom against upward and downward competitor shifts implies a consolidation phase where maintaining #5 requires defending share against faster climbers while selectively targeting openings created by rank declines directly above it.

Notable Products
The Soap Pre-Roll (1g) posted the steepest movement in September 2026 with a -23.2% MoM drop and slid to rank 5, while Tricheratrops Pre-Roll (1g) also contracted -15.8% at rank 10; by contrast, Honey Banana Pre-Roll (1g) rose +27.9% but stayed outside the top five, which signals volatility concentrated at the lower end of the leaderboard. Wedding Cake Pre-Roll (1g) held rank 1 with a modest +3.9% MoM and Cherry Pie OG Pre-Roll (1g) remained at rank 2 with +2.9%, whereas Cherry Pie OG (3.5g) in Flower fell -17.6% to rank 8 despite $69,611 in sales, indicating a divergence between pre-roll stability at the top and Flower retrenchment mid-pack. With eight of the top ten SKUs in September 2026 coming from the Pre-Roll category and mixed MoM outcomes ranging from -23.2% to +27.9%, assortment weight is clearly consolidating around pre-rolls while single-strain Flower exposure is being trimmed. The pattern implies Root & Bloom is tilting commercial focus toward pre-roll velocity and away from Flower dependency, prioritizing depth in leading pre-roll SKUs over breadth across categories.
Top Selling Cannabis Brands






Data for this report comes from real-time sales reporting by participating cannabis retailers via their point-of-sale systems, which are linked up with Headset’s business intelligence software. Headset’s data is very reliable, as it comes digitally direct from our partner retailers. However, the potential does exist for misreporting in the instance of duplicates, incorrectly classified products, inaccurate entry of products into point-of-sale systems, or even simple human error at the point of purchase. Thus, there is a slight margin of error to consider. Brands listed on this page are ranked in the top twenty within the market and product category by total retail sales volume.

