.svg)

Aug-2026
Sales
Trend
6-Month
Product Count
SKUs
Avg Price
YoY Sales Change
YoY Price Change


Where to Buy
Crispy Commission Concentrates is stocked at 119 licensed dispensaries across Massachusetts, with the deepest coverage in Boston, Worcester, Fall River, Easthampton, and Lynn. Search by ZIP code or city below to find the closest one, or filter by product type if you are after a specific format.
Market Insights Snapshot
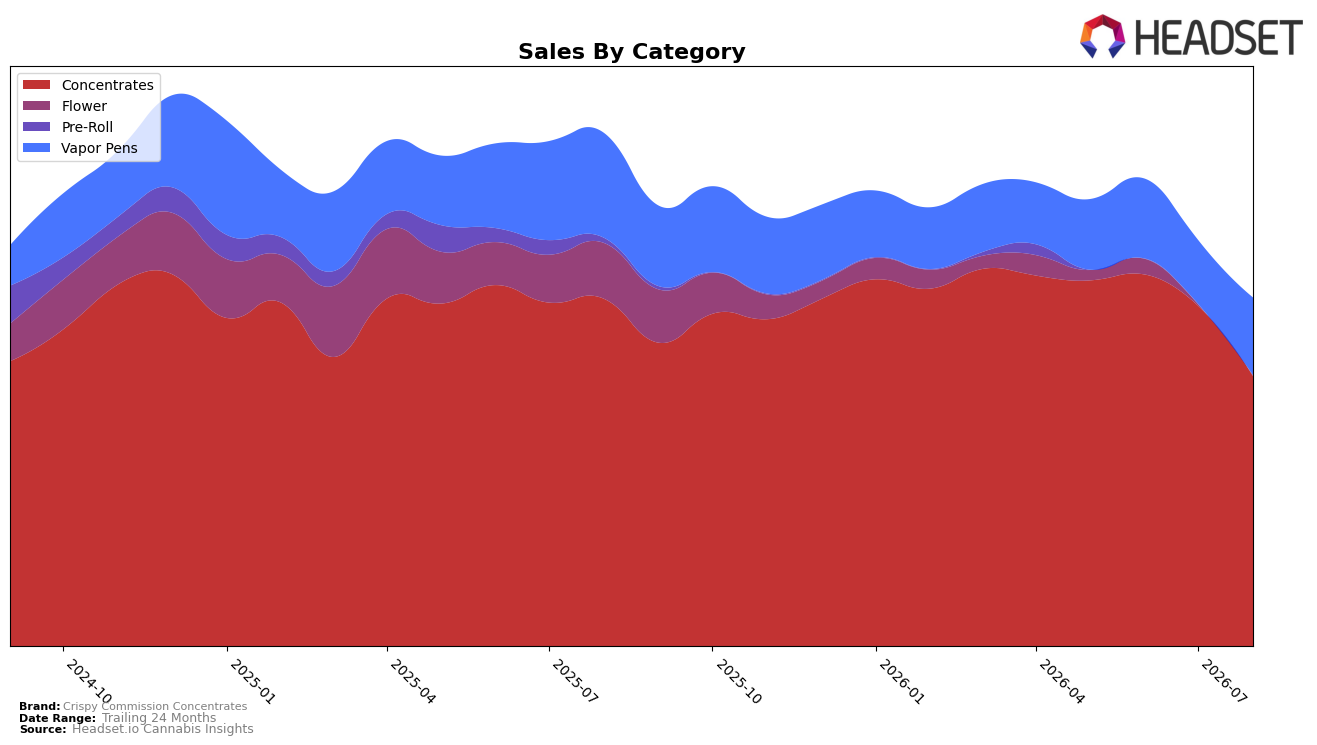
In August 2026, Crispy Commission Concentrates derived 77.63% of sales from Concentrates and 22.23% from Vapor Pens, with Concentrates down 22.33% year over year and 20.77% month over month, while Vapor Pens fell 26.13% year over year but rose 21.32% month over month. Flower contracted to 0.13% share with a 99.16% year-over-year decline and a 59.84% month-over-month drop, and the brand’s average price moved 0.30% higher as Concentrates averaged $37.11. Given a category rank of 2 in Concentrates in Massachusetts and a 32.16% brand-level year-over-year sales decline, the mix shift implies reliance on a weakening core (Concentrates) partially offset by a short-term Vapor Pens rebound that is too small in share to counter the core contraction.
The combination of a 20.77% month-over-month drop in Concentrates alongside a 21.32% month-over-month lift in Vapor Pens suggests the brand is losing depth in its primary category while gaining some breadth in an adjacent format, with the 0.30% price uptick limiting volume recovery. With Concentrates still at 77.63% share and Vapor Pens at 22.23% share, the positioning remains Concentrates-led, but August 2026 dynamics point to a need to defend the rank-2 slot in Massachusetts Concentrates as share leakage could accelerate if the month-over-month decline persists and the smaller Vapor Pens base cannot scale fast enough to absorb a 22.33% year-over-year contraction in the core.
Competitive Landscape
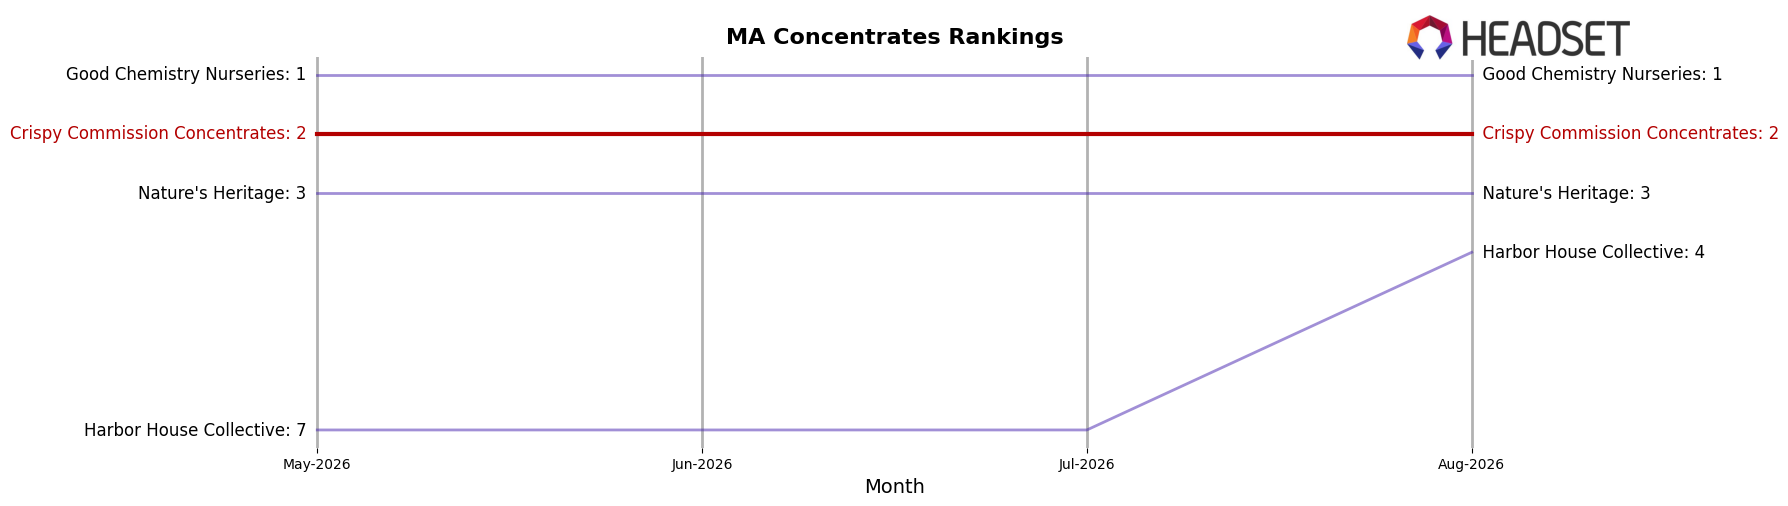
Crispy Commission Concentrates sits at rank #2 in MA Concentrates in August 2026, unchanged YoY from #2, while its peak rank was #1 in October 2025 and its 3-month position also held at #2; meanwhile, Good Chemistry Nurseries is #1 now after holding #1 YoY with a 61.99% sales increase, and Nature's Heritage moved from #4 YoY to #3 with 24.92% YoY growth. The contrast widens further with Harbor House Collective climbing from #9 YoY to #4 on 79.87% YoY growth and Bountiful Farms slipping from #3 YoY to #5 with an 18.62% YoY decline, indicating that Crispy Commission Concentrates’ flat rank trajectory at #2 amid faster-moving rivals points to a need for share-defense tactics if a return to #1 is the goal.
Notable Products
Tricheratrops Cured Budder (1g) led with a month-over-month jump of 64.3% to rank 1, while Ghost Dawg Cured Budder (1g) slipped 15.6% at rank 9, marking a widening gap within the same format. Hydrid Diamond Dust (1g) rose 24.4% at rank 2, and five of the top ten are Concentrates SKUs clustered in ranks 1, 2, 3, 5, and 9, indicating the core traction still sits in dabbables despite mixed momentum inside the segment. Vapor Pens hold ranks 4, 7, 8, and 10 with no reported month-over-month changes and one item reaching $15,777, suggesting a steady but less dynamic contribution versus the surge at the top of Concentrates. The pattern implies Crispy Commission Concentrates is tilting its product mix toward high-velocity cured budder leaders while maintaining Vapor Pens as a stable secondary pillar.
Top Selling Cannabis Brands






Data for this report comes from real-time sales reporting by participating cannabis retailers via their point-of-sale systems, which are linked up with Headset’s business intelligence software. Headset’s data is very reliable, as it comes digitally direct from our partner retailers. However, the potential does exist for misreporting in the instance of duplicates, incorrectly classified products, inaccurate entry of products into point-of-sale systems, or even simple human error at the point of purchase. Thus, there is a slight margin of error to consider. Brands listed on this page are ranked in the top twenty within the market and product category by total retail sales volume.

