.svg)

Sep-2026
Sales
Trend
6-Month
Product Count
SKUs
Avg Price
YoY Sales Change
YoY Price Change


Where to Buy
Good Chemistry Nurseries is stocked at 118 licensed dispensaries across Massachusetts and Colorado, 99 of them in Massachusetts, with the deepest coverage in Boston, Northampton, Worcester, Brockton, and Lynn. Search by ZIP code or city below to find the closest one, or filter by product type if you are after a specific format.
Market Insights Snapshot
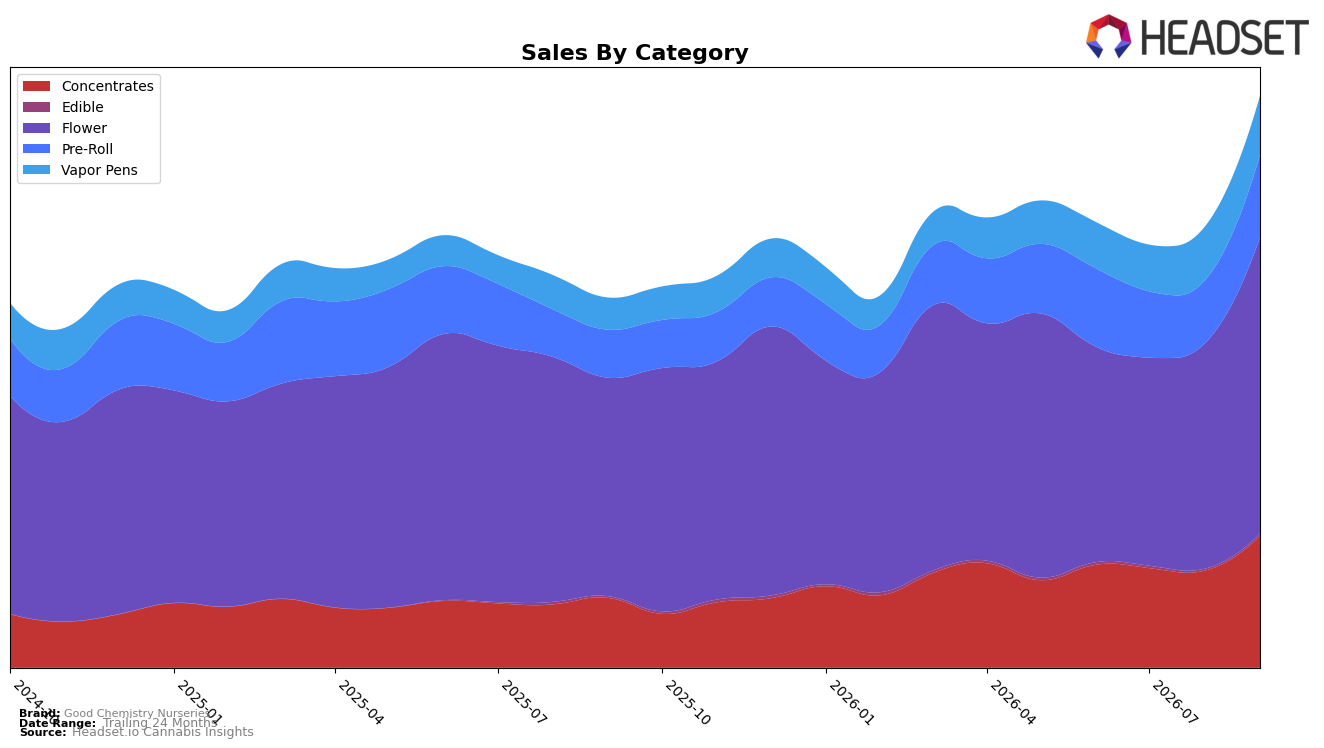
In September 2026, Good Chemistry Nurseries leaned further into core inhalables as Flower held 51.80% share with 35.45% year-over-year and 31.46% month-over-month growth, while Concentrates expanded to 23.09% share on 89.31% YoY and 36.01% MoM. Pre-Roll advanced to 14.43% share with 72.60% YoY and 31.35% MoM, and Vapor Pens reached 10.32% share on 84.38% YoY and 10.00% MoM; smaller Edible activity remained at 0.36% share with 45.57% YoY and 24.10% MoM. With Flower ranked 2 in Colorado and the brand’s total sales up 54.69% YoY alongside a 0.13% YoY uptick in average price, the mix shift toward Concentrates and Vapor Pens implies the portfolio is capturing faster-growing, higher-price-per-unit segments while sustaining its Flower base.
The acceleration in Concentrates (+89.31% YoY) and Vapor Pens (+84.38% YoY) relative to Flower (+35.45% YoY) suggests a deliberate tilt toward repeatable, potency-forward formats that can lift revenue density even as average price only rose 0.13% YoY; the 36.01% MoM gain in Concentrates versus 10.00% MoM in Vapor Pens indicates near-term momentum is skewing more toward dabbable SKUs than carts. Pre-Roll’s 31.35% MoM alongside a 72.60% YoY jump, combined with Flower’s 31.46% MoM, points to cross-format basket behavior tied to inhalable freshness and value, implying Good Chemistry Nurseries can defend its rank-2 Flower position in Colorado while using Concentrates and Pre-Roll to diversify share without diluting the flagship category.
Competitive Landscape
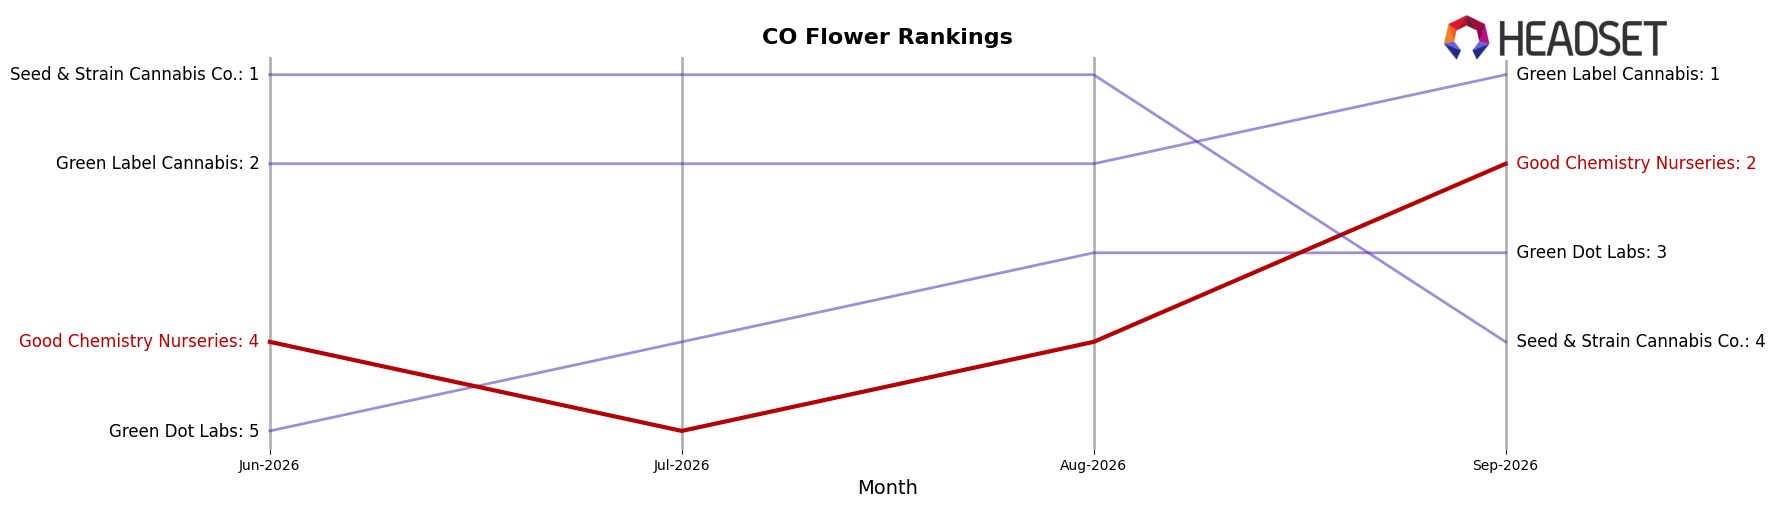
Good Chemistry Nurseries sits at rank #2 in Colorado Flower in September 2026, a climb of 1 position YoY from #3, and up 2 spots since June 2026 when it was #4; however, it remains 1 rank below its peak at #1 from December 2025. Against competitors, Green Label Cannabis held #1 both this month and a year ago while growing sales 38.0% YoY, and Green Dot Labs improved to #3 from #4 with 33.4% YoY sales growth, whereas Seed & Strain Cannabis Co. slid from #2 to #4 as sales fell 33.5% YoY. The pattern—rising 1 rank YoY and 2 ranks in three months while a key rival advances and another retreats—implies Good Chemistry Nurseries is consolidating a top-two position but must outpace the incumbent leader to reclaim #1.
Notable Products
Zealousy (3.5g) posted the largest month-over-month movement with a +46.5% increase and entered the top ten at rank 10, while Flower dominated ranks 1, 2, 5, 6, 7, 9, and 10 for a seven-of-ten concentration that crowds out Pre-Roll at ranks 3, 4, and 8. Gravy (3.5g) sits at rank 1 and Peach Maraschino (3.5g) at rank 2, framing a top-two entirely in Flower as Pre-Roll leadership begins only at rank 3. With Dirty Turtle (3.5g) at rank 9 alongside Zealousy’s surge at rank 10, the tail of the leaderboard is tilting toward late-rising Flower SKUs even as early positions remain anchored by established Flower entries. This pattern implies Good Chemistry Nurseries is consolidating around Flower depth, using multiple mid-to-late rank Flower movers to reinforce a category-heavy mix while Pre-Roll plays a secondary role.
Top Selling Cannabis Brands






Data for this report comes from real-time sales reporting by participating cannabis retailers via their point-of-sale systems, which are linked up with Headset’s business intelligence software. Headset’s data is very reliable, as it comes digitally direct from our partner retailers. However, the potential does exist for misreporting in the instance of duplicates, incorrectly classified products, inaccurate entry of products into point-of-sale systems, or even simple human error at the point of purchase. Thus, there is a slight margin of error to consider. Brands listed on this page are ranked in the top twenty within the market and product category by total retail sales volume.

