Apr-2026
Sales
Trend
6-Month
Product Count
SKUs
Avg Price
YoY Sales Change
YoY Price Change
Market Insights Snapshot
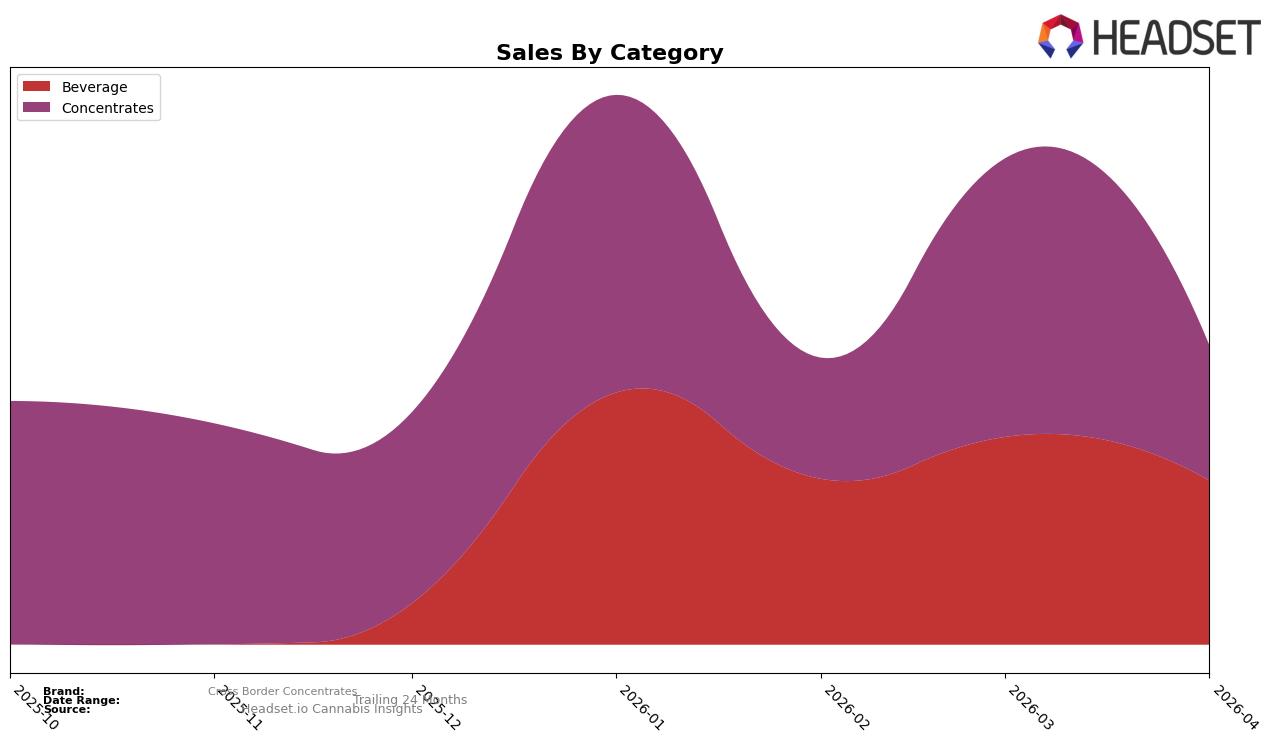
Cross Border Concentrates has shown a fluctuating performance across different categories and regions, with notable activity in Ontario. In the Beverage category, the brand made its way into the top 30 in January and March, ranking 25th and 30th respectively, but failed to maintain its position in February and April. This inconsistency suggests potential challenges in sustaining market presence, which could be due to competitive pressures or shifts in consumer preferences. However, the brand's ability to re-enter the top 30 in March indicates some resilience or effective short-term marketing strategies.
In the Concentrates category within Ontario, Cross Border Concentrates did not make it into the top 30, with ranks around 54th to 55th in January and March. This consistently lower performance compared to the Beverage category suggests that the brand might be facing stronger competition or that its product offerings in this category are less appealing to consumers. The absence of top 30 rankings in February and April across both categories could be a signal for the brand to reassess its strategies or product offerings. Despite these challenges, the brand's presence in multiple categories highlights potential areas for growth and improvement.
Competitive Landscape
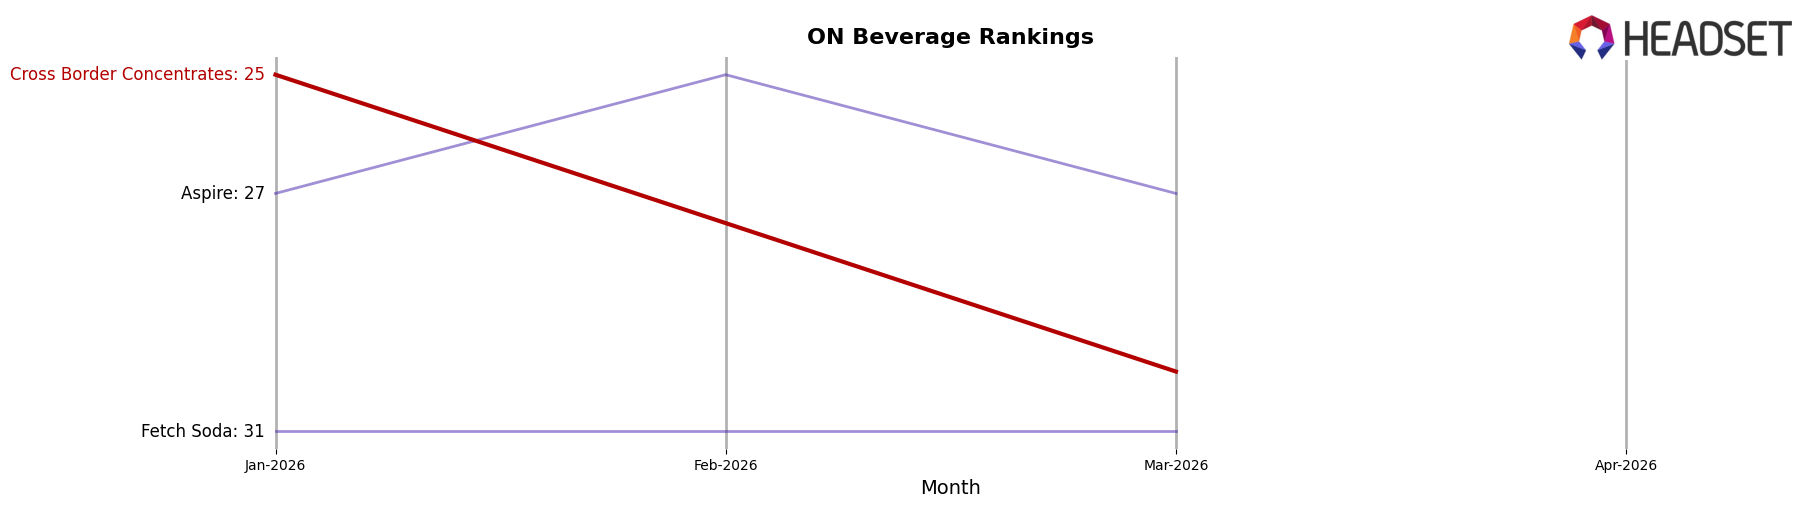
In the competitive landscape of the beverage category in Ontario, Cross Border Concentrates has experienced fluctuations in its market position, which could impact its sales strategy. In January 2026, Cross Border Concentrates held the 25th rank, but by March 2026, it had slipped to 30th, indicating a need for strategic adjustments to regain its standing. This downward trend is contrasted by competitors like Aspire, which maintained a relatively stable presence, moving from 27th in January to 27th in March, and Fetch Soda, which reappeared in the rankings at 31st in March after not ranking in February. These shifts suggest that while Cross Border Concentrates faces challenges, there is an opportunity to analyze competitors' strategies to enhance its competitive edge and potentially reclaim a higher rank in the coming months.
Notable Products
In April 2026, Cherry Limeade Soda from Cross Border Concentrates maintained its top position in the Beverage category, continuing its streak as the number one product since January, although sales slightly decreased to 1308 units. The Hybrid Live Solventless Temple Ball Hash held steady in second place within the Concentrates category, with sales figures showing a slight increase compared to February but a decrease from January. Similarly, the Hybrid Live Rosin Budder consistently ranked third in the Concentrates category, experiencing a gradual decline in sales from January through April. Notably, these rankings have remained unchanged across the first four months of 2026, indicating stable consumer preferences within Cross Border Concentrates' product offerings. This consistency suggests a strong brand loyalty and satisfaction with these top-performing products.
Top Selling Cannabis Brands
Data for this report comes from real-time sales reporting by participating cannabis retailers via their point-of-sale systems, which are linked up with Headset’s business intelligence software. Headset’s data is very reliable, as it comes digitally direct from our partner retailers. However, the potential does exist for misreporting in the instance of duplicates, incorrectly classified products, inaccurate entry of products into point-of-sale systems, or even simple human error at the point of purchase. Thus, there is a slight margin of error to consider. Brands listed on this page are ranked in the top twenty within the market and product category by total retail sales volume.

