Market Insights Snapshot
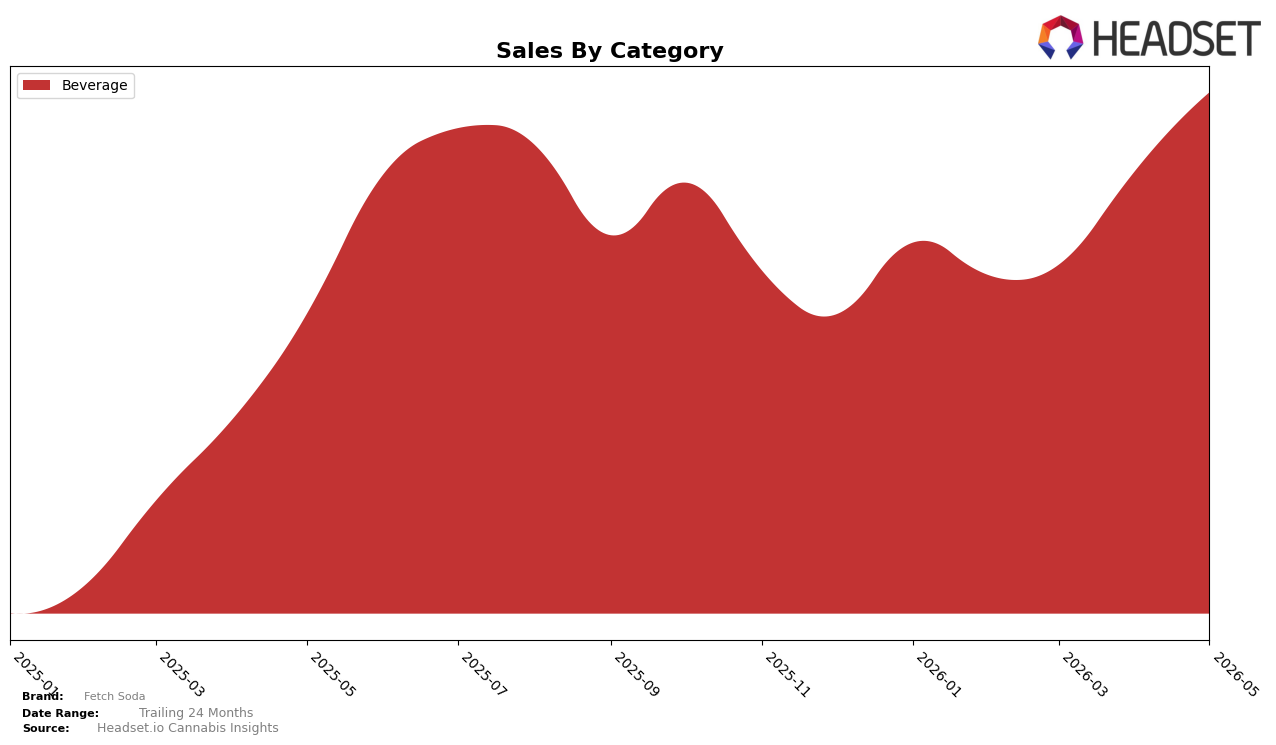
In May 2026, Fetch Soda operated exclusively in Beverage, with category share at 100.0% and average price up 2.9% year over year while category sales rose 73.9% YoY and 17.7% month over month; the single-category focus coincided with a AB-anchored footprint and a category rank of 14 in Alberta. The combination of triple-digit share concentration and a mid-teens MoM lift implies the brand is leveraging a narrow SKU mix to accelerate velocity rather than breadth, signaling that current growth depends on deepening Beverage penetration more than portfolio expansion.
With Beverage accounting for 100.0% of sales and May 2026 MoM growth at 17.7% against a 73.9% YoY increase, Fetch Soda’s trajectory indicates momentum concentrated in repeat or expanded basket incidence within existing outlets rather than new-category trial; the 14th position in Alberta suggests headroom to climb ranks by converting velocity gains into distribution or premium tier trade-up. This pattern implies near-term positioning as a focused Beverage specialist where incremental price headroom of 2.9% YoY can be used tactically without eroding the observed MoM acceleration, prioritizing rank advancement over diversification.
Competitive Landscape
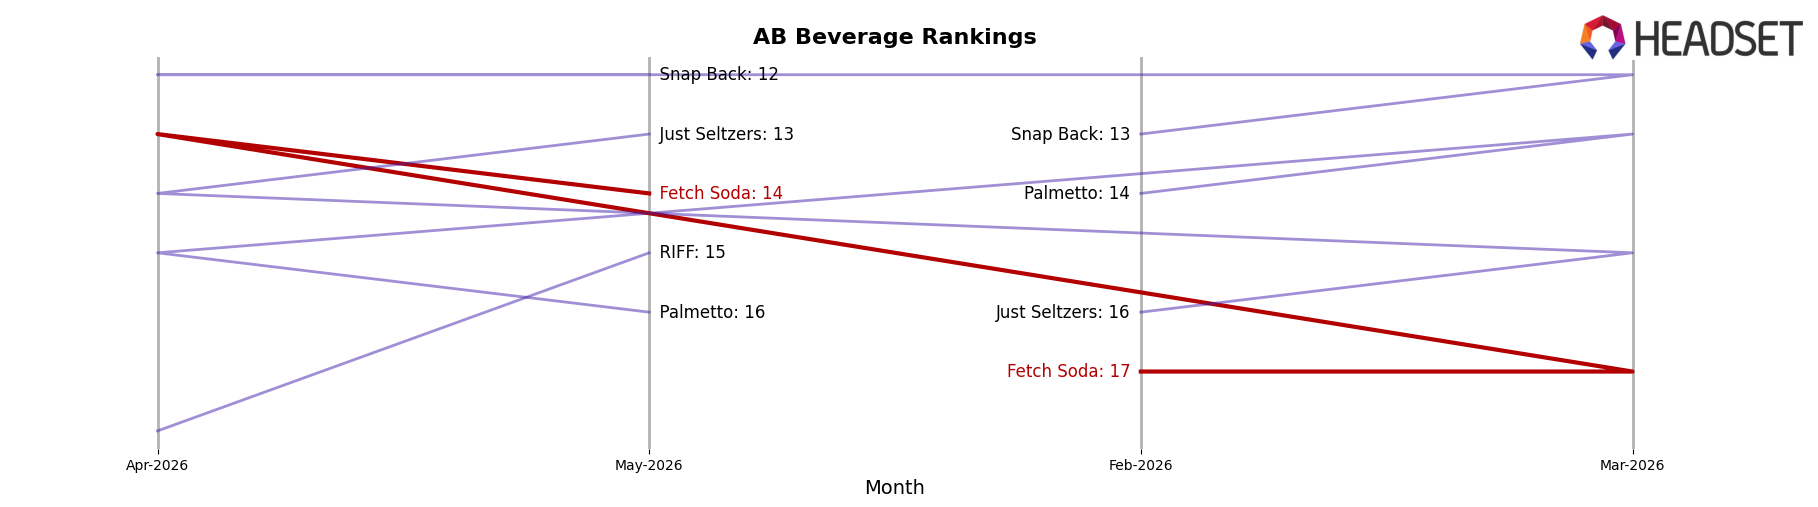
Fetch Soda sits at #14 in AB Beverage in May 2026, improving 10 ranks year over year from #24 and 3 ranks versus February 2026 when it was #17; despite peaking at #13 in April 2026, the brand slipped 1 position month over month, while category leaders moved in divergent directions as XMG held #1 despite a 19.8% YoY sales decline and Mary Jones climbed from #18 to #2 on a 3708.2% YoY sales surge. The juxtaposition of a 1-rank dip after an April 2026 peak and a 10-rank YoY climb implies Fetch Soda is transitioning from recovery to consolidation, with its competitive path defined by maintaining mid-teen ranking stability while faster-moving rivals either contract from a high base or expand rapidly from lower ranks.
Notable Products
Cream Soda (600mg THC, 12oz, 355ml) posted the largest movement in May 2026 with a +52.8% MoM surge, yet it held only rank 3, while Zero Lemon Lime Soda (10mg THC, 12oz, 355ml) stayed at rank 1 with +19.5% MoM and Zero Classic Cola (10mg THC, 12oz, 355ml) sat at rank 2 with +11.0% MoM. All named SKUs are Beverage products, concentrating the top positions within a single category, and the rank spread of 1–3 coupled with double-digit MoM gains suggests the portfolio is tilting toward sodas with differentiated dose tiers rather than breadth expansion.
Top Selling Cannabis Brands
Data for this report comes from real-time sales reporting by participating cannabis retailers via their point-of-sale systems, which are linked up with Headset’s business intelligence software. Headset’s data is very reliable, as it comes digitally direct from our partner retailers. However, the potential does exist for misreporting in the instance of duplicates, incorrectly classified products, inaccurate entry of products into point-of-sale systems, or even simple human error at the point of purchase. Thus, there is a slight margin of error to consider. Brands listed on this page are ranked in the top twenty within the market and product category by total retail sales volume.

