Jun-2026
Sales
Trend
6-Month
Product Count
SKUs
Avg Price
YoY Sales Change
YoY Price Change
Market Insights Snapshot
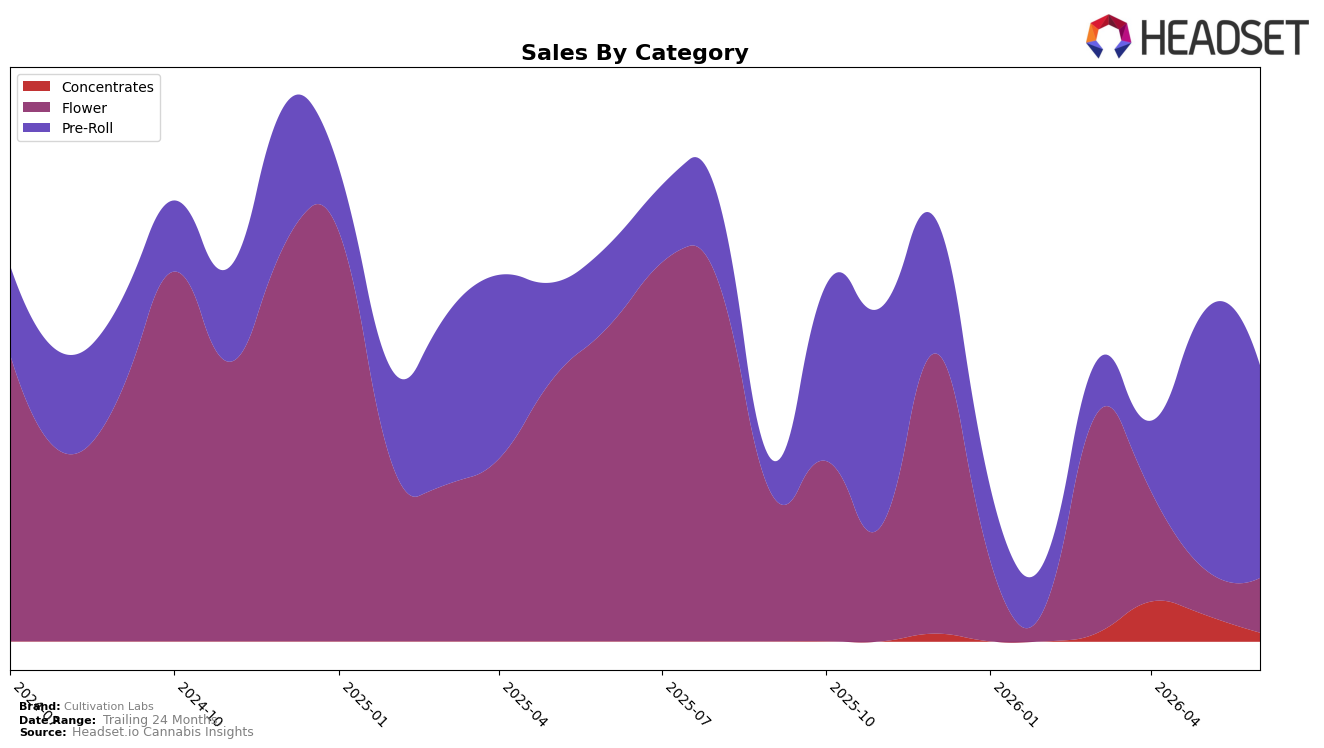
Cultivation Labs concentrated 77.10% of June 2026 sales in Pre-Roll, up within category by 161.30% year over year but down 17.72% month over month, while Flower held 19.73% share with a 82.70% year-over-year decline and a 20.24% month-over-month rebound; Concentrates were 3.16% share with a 67.34% month-over-month drop and no year-over-year baseline. Despite overall brand sales falling 30.36% year over year and average price down 63.56%, the Pre-Roll-heavy mix alongside a Pre-Roll rank of 28 in Nevada implies a pivot toward lower-priced volume in a single category that is counterbalancing steep contraction in Flower.
The shift toward a 77% Pre-Roll mix, coupled with a 17.72% month-over-month pullback in that category and a 20.24% month-over-month lift in Flower, signals rising exposure to price-sensitive, multipack or value segments and greater volatility risk if Pre-Roll demand softens. With average prices compressing 63.56% and Concentrates shrinking 67.34% month over month to just 3.16% share, the portfolio implies a positioning trade-off: defend rank 28 in Nevada Pre-Rolls via price and volume while accepting reduced premium footprint in Flower, which may limit margin recovery even if category rebounds.
Competitive Landscape
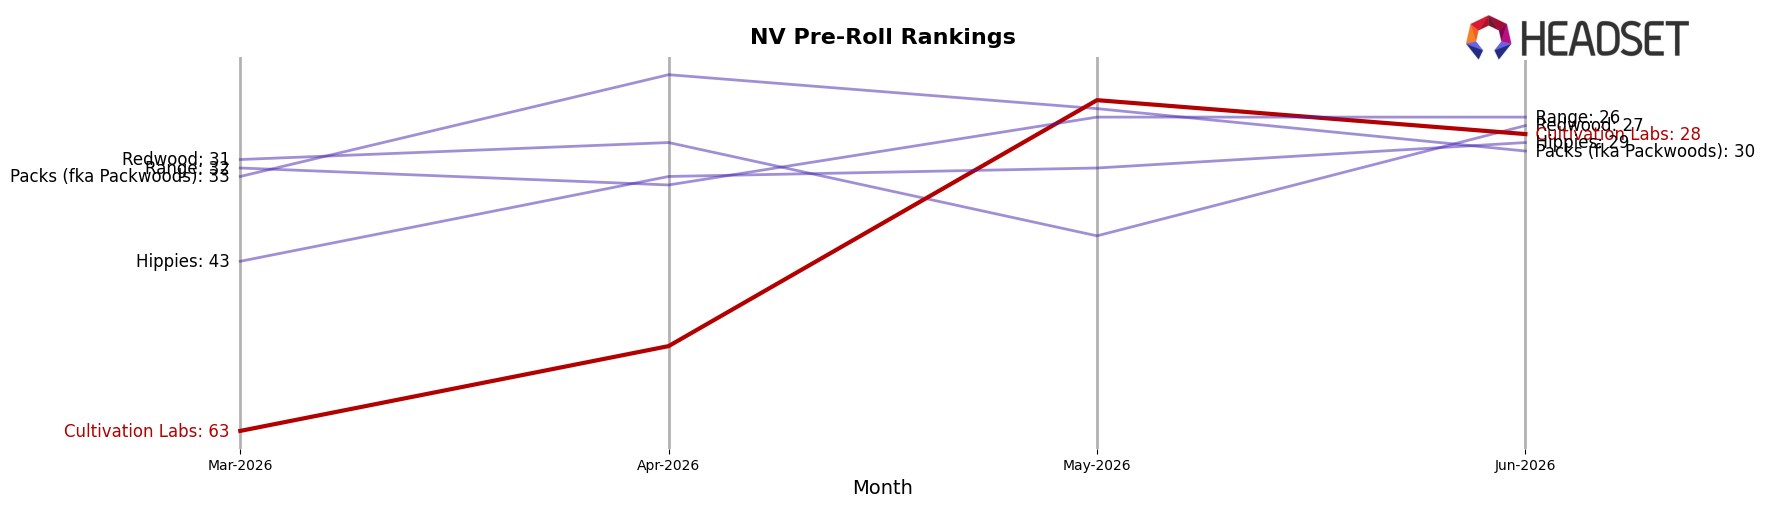
Cultivation Labs sits at rank #28 in NV Pre-Roll in June 2026, improving 27 positions from #55 year over year, and rising 35 places from #63 in March 2026, while remaining below its peak of #23 from November 2025; meanwhile, STIIIZY held steady at #1 with a -34.8% YoY sales change and Rove climbed from #4 to #2 with a 63.7% YoY increase, indicating Cultivation Labs is gaining rank share against leaders despite mixed category momentum, and the trajectory suggests a continued path toward the low-20s if conversion from rank recovery to sustained velocity continues.
Notable Products
Fire Diesel Pre-Roll (1g) posted the steepest move in June 2026 with a -77.9% month-over-month drop and slipped to rank 9, while Jenny Kush Pre-Roll (1g) fell -13.7% yet held rank 1. Scotch & Soda Pre-Roll (1g) declined -14.9% and stayed at rank 2, indicating that top-line leadership is intact despite sharper volatility in the lower half of the ranking. The pattern implies dependence on one flagship SKU for share stability while tail products are shedding velocity.
Pre-Rolls account for nine of the top ten SKUs, led by Jenny Kush Pre-Roll (1g) at rank 1 and Scotch & Soda Pre-Roll (1g) at rank 2, but category breadth is pressured by -34.8% for Cheddar Cheeze Pre-Roll (1g) at rank 5 and -36.7% for Las Vegas Lemon Pre-Roll (1g) at rank 8. The only Flower entry, Jenny Kush (1g), sits at rank 6 with a -6.4% month-over-month change and $12,613 in June 2026 sales, underscoring limited diversification across formats. This concentration implies a need to rebalance the mix toward fewer volatile variants or expand non–Pre-Roll formats to stabilize rank distribution.
Top Selling Cannabis Brands
Data for this report comes from real-time sales reporting by participating cannabis retailers via their point-of-sale systems, which are linked up with Headset’s business intelligence software. Headset’s data is very reliable, as it comes digitally direct from our partner retailers. However, the potential does exist for misreporting in the instance of duplicates, incorrectly classified products, inaccurate entry of products into point-of-sale systems, or even simple human error at the point of purchase. Thus, there is a slight margin of error to consider. Brands listed on this page are ranked in the top twenty within the market and product category by total retail sales volume.

