Jun-2026
Sales
Trend
6-Month
Product Count
SKUs
Avg Price
YoY Sales Change
YoY Price Change
Market Insights Snapshot
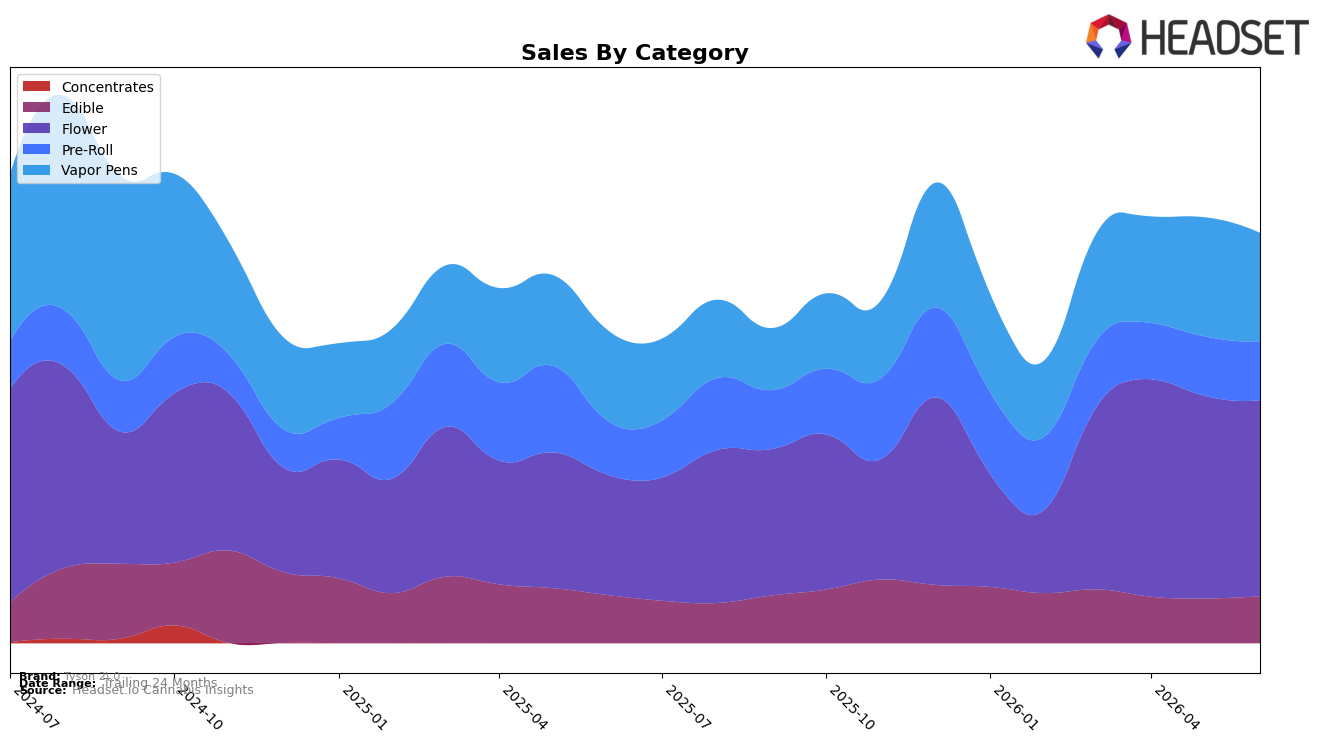
In June 2026, Tyson 2.0 leaned further into Flower, which rose to 47.81% of mix with 63.09% year-over-year growth even as month-over-month slipped 3.34%, while Vapor Pens held 26.57% share with 20.50% YoY but an 8.50% MoM drop. Pre-Roll accounted for 14.20% of sales with 8.32% YoY and a 1.86% MoM dip, and Edible reached 11.43% share with a 5.36% MoM increase despite a 2.07% YoY decline. With overall brand sales up 31.34% YoY and average price down 4.30% YoY to $19.27, the pattern implies volume-led gains concentrated in Flower while Pen softness pulls on short-term momentum.
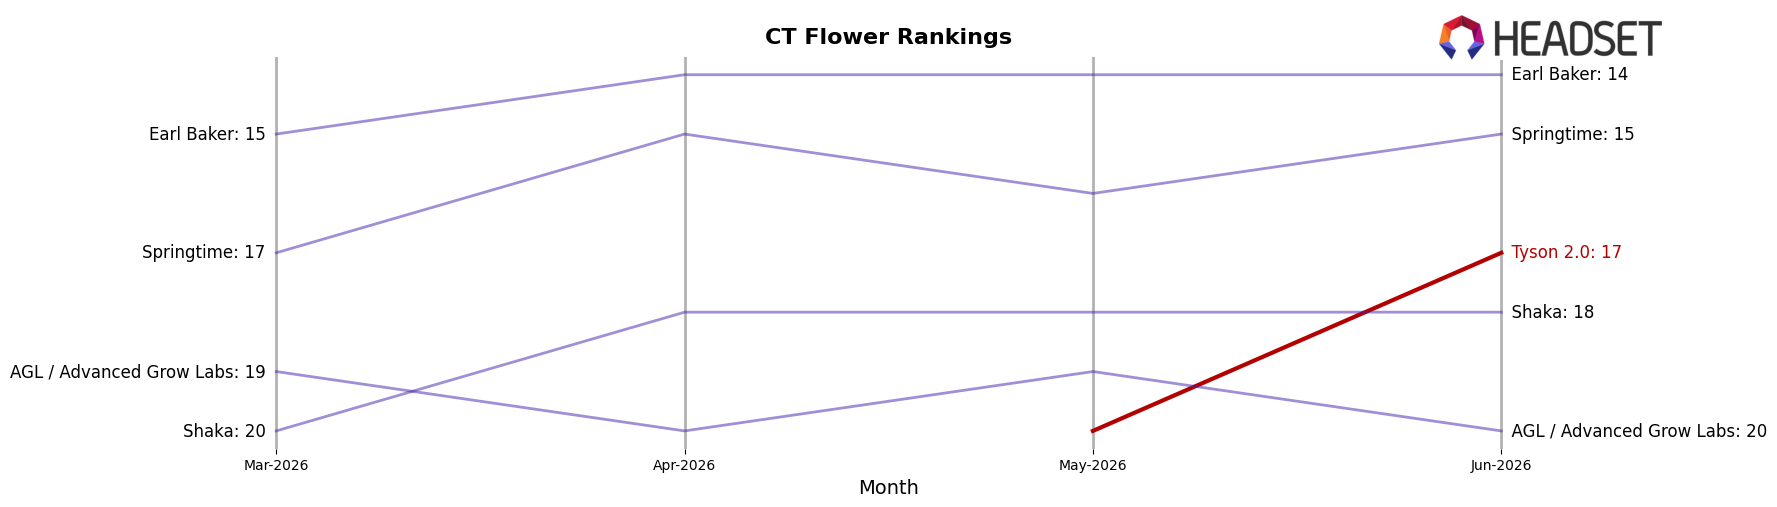
The mix and price moves suggest Tyson 2.0 is positioning around value-forward inhalables: Flower’s 63.09% YoY combined with a 3.34% MoM pullback and Vapor Pens’ 8.50% MoM decline point to elasticity-driven share defense as prices ease, while Edible’s 5.36% MoM uptick against a 2.07% YoY dip signals opportunistic rebound without yet altering the core. Holding rank 17 in Flower in Connecticut alongside a 47.81% category share implies that improving Flower execution would yield the clearest route to rank and share gains, whereas further MoM pressure in Pens could dilute that path.
Competitive Landscape
Tyson 2.0 sits at rank #17 in Connecticut Flower in June 2026, matching its peak position at #17 but with no year-over-year rank available, signaling a late entry or data gap rather than upward movement; meanwhile, Theraplant moved to #1 from #5 year over year and expanded sales by 69%, and Find. advanced to #4 from #9 with an 87% sales increase. In contrast, Affinity Grow holds #3 despite a 4-place climb paired with a 2% sales decline, while All:Hours rose to #5 from #8 on 68% growth, indicating that Tyson 2.0’s static debut at #17 is occurring amid rapid competitor rank mobility upward; the pattern implies Tyson 2.0 must convert presence at #17 into sequential rank gains quickly, because the acceleration of peers at +4 to +5 ranks year over year reduces the slack for late movers.
Notable Products
Sherb Cream Pie (7g) posted the steepest movement in June 2026 with a -14.9% month-over-month decline, slipping to rank 9 while the Gelato 44 Pre-Roll (1g) rose +12.9% to rank 7. Knockout OG (3.5g) held rank 1 with no reported month-over-month rate, and three of the top ten are Flower SKUs, indicating the category anchors the leaderboard even as the only clear contraction sits within the multi-ounce format. The Haymaker Haze Pre-Roll (1g) added +11.4% MoM at rank 8, and with Pre-Rolls claiming three of the top ten alongside a single Vapor Pens entry at rank 10, the mix tilts toward quick-turn inhalables while large-format Flower faces pressure. The pattern implies Tyson 2.0 is consolidating demand around smaller, ready-to-use formats, with value-sized Flower becoming the margin-management lever rather than the growth engine.
Top Selling Cannabis Brands
Data for this report comes from real-time sales reporting by participating cannabis retailers via their point-of-sale systems, which are linked up with Headset’s business intelligence software. Headset’s data is very reliable, as it comes digitally direct from our partner retailers. However, the potential does exist for misreporting in the instance of duplicates, incorrectly classified products, inaccurate entry of products into point-of-sale systems, or even simple human error at the point of purchase. Thus, there is a slight margin of error to consider. Brands listed on this page are ranked in the top twenty within the market and product category by total retail sales volume.

