.svg)
Sep-2026
Sales
Trend
6-Month
Product Count
SKUs
Avg Price
YoY Sales Change
YoY Price Change


Where to Buy
Cultured is stocked at 58 licensed dispensaries across New York, with the deepest coverage in New York, Rochester, Staten Island, Buffalo, and Brooklyn. Search by ZIP code or city below to find the closest one, or filter by product type if you are after a specific format.
Market Insights Snapshot
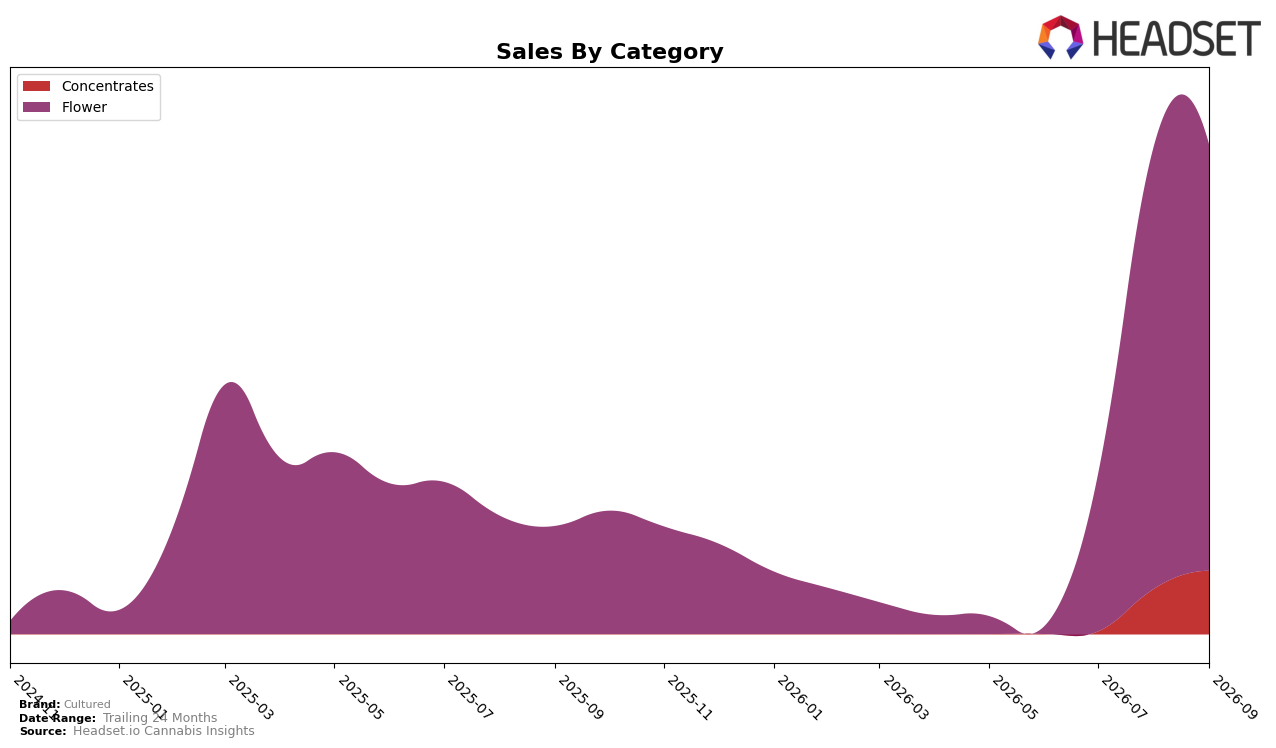
In September 2026, Cultured concentrated 87.03% of sales in Flower while allocating 12.97% to Concentrates, with Flower down 3.89% month over month but up 294.55% year over year and Concentrates up 40.23% month over month off a smaller base; meanwhile, average price fell 27.70% year over year to $28.02, and Flower’s average price sat at $26.81 versus $40.17 in Concentrates. With a Flower rank of 76 in New York and a 353.35% brand-level year-over-year sales increase, the mix tilt toward Flower and the divergent MoM trajectories imply Cultured is trading price for volume in Flower while testing incremental growth leverage in Concentrates.
The widening gap between a 294.55% YoY expansion in Flower (despite a 3.89% MoM dip) and a 40.23% MoM surge in Concentrates suggests a positioning pivot: Flower functions as the volume engine at lower price points, while Concentrates act as the margin stabilizer with higher average price. Holding 87.03% share in Flower alongside a September 2026 rank of 76 in New York indicates headroom to trade mix toward the 12.97% Concentrates slice if the recent MoM momentum persists, implying that near-term gains likely depend on balancing further price compression against shifting a few share points into higher-ticket formats.
Competitive Landscape
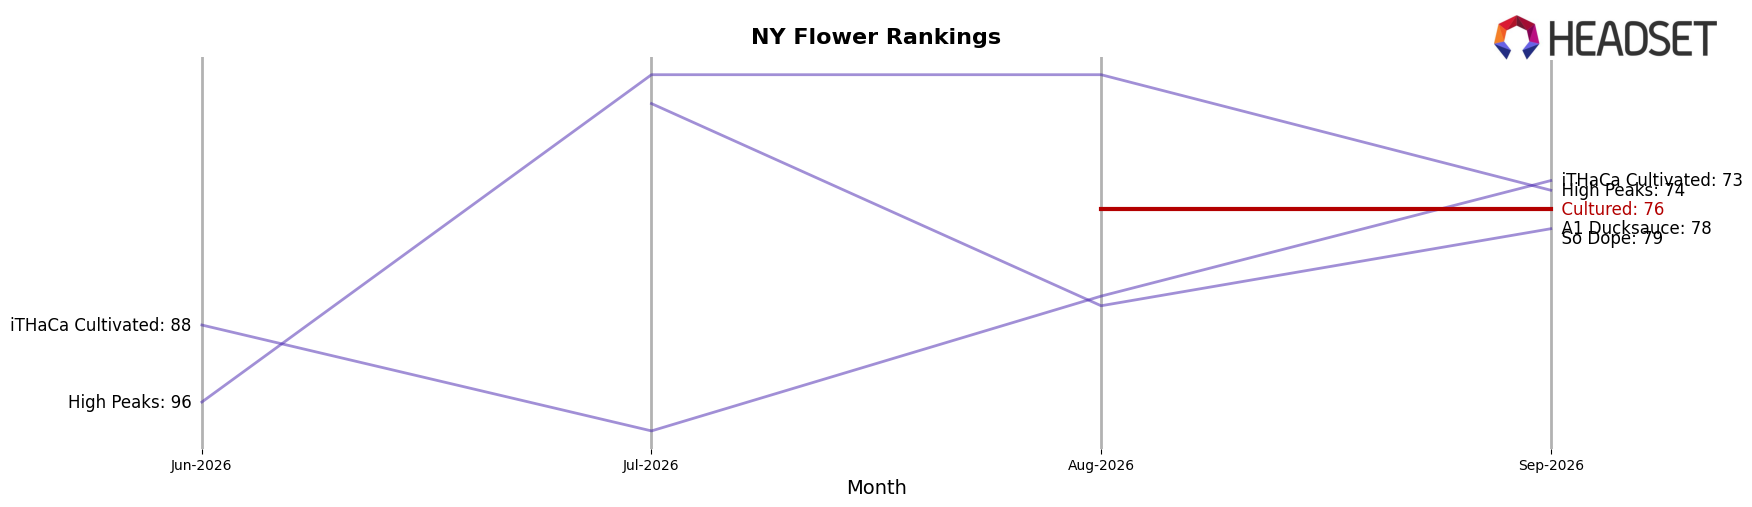
Cultured sits at rank #76 in NY Flower in September 2026, a 85-place climb from #161 year over year and a 238-place rise from #314 since June 2026; this is also its peak rank to date at #76 in September 2026. In contrast, Find. moved up from #5 to #1 with 16.2% YoY sales growth, while Grassroots advanced from #15 to #2 on 150.3% YoY sales growth, indicating that Cultured’s rank gains are occurring alongside faster-moving leaders at the top. The pattern implies Cultured has shifted from peripheral presence to mid-tier contention, but the gap to the top cohort is widening unless rank momentum converts into share capture against brands ascending from #9 to #3 and #8 to #5.
Notable Products
Sour Diesel (3.5g) posted the largest movement with a 120.7% month-over-month gain and rose to rank 1, while Diamond Breeze (3.5g) climbed with an 89.5% increase at rank 4. Rainbow Gelato (3.5g) advanced 23.8% at rank 5 and Apex Lava (3.5g) gained 21.5% at rank 6, and nine of the top ten are Flower SKUs. This concentration, paired with the single triple-digit mover at the top and only one Concentrates SKU at rank 9 up 29.5%, implies Cultured is leaning into Flower momentum and prioritizing high-velocity eighths.
Top Selling Cannabis Brands






Data for this report comes from real-time sales reporting by participating cannabis retailers via their point-of-sale systems, which are linked up with Headset’s business intelligence software. Headset’s data is very reliable, as it comes digitally direct from our partner retailers. However, the potential does exist for misreporting in the instance of duplicates, incorrectly classified products, inaccurate entry of products into point-of-sale systems, or even simple human error at the point of purchase. Thus, there is a slight margin of error to consider. Brands listed on this page are ranked in the top twenty within the market and product category by total retail sales volume.

