.svg)

Sep-2026
Sales
Trend
6-Month
Product Count
SKUs
Avg Price
YoY Sales Change
YoY Price Change


Market Insights Snapshot
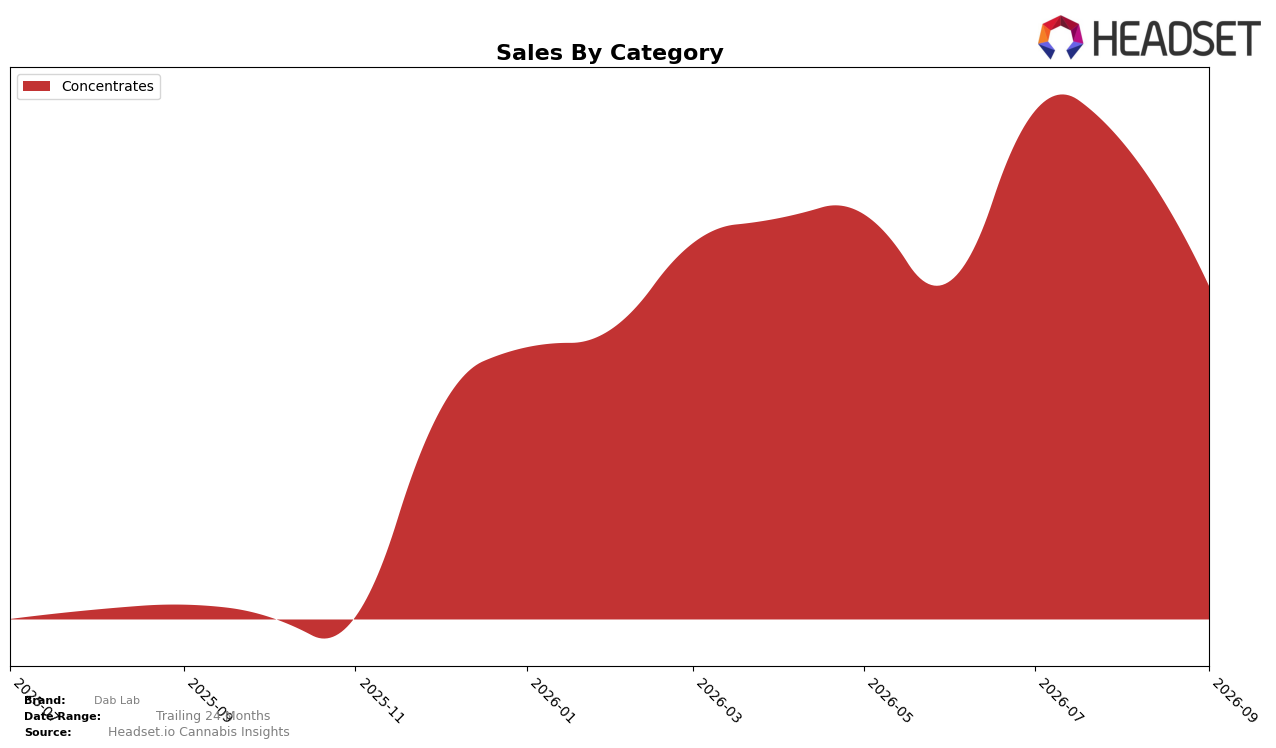
In September 2026, Dab Lab operated as a single-category brand with Concentrates at 100.0% mix, placing the entire portfolio on one product type while the brand held rank 30 in Michigan Concentrates. Year over year, Concentrates sales rose 1754.2%, while month over month the same category declined 30.1%, and the average price climbed 483.3% to $58.88. The pattern implies a rapid expansion off a small base that is now encountering short-term pullback within one category, concentrating both upside and volatility in the same lane.
The combination of a 1754.2% annual surge with a 30.1% monthly dip and a 483.3% price escalation suggests a positioning anchored in higher-priced Concentrates that lifted revenue but tightened near-term velocity, as evidenced by rank 30 in Michigan. With 100.0% of sales in Concentrates, the brand’s competitiveness hinges on sustaining premium conversion at elevated price points while managing the demand elasticity that pulled down September momentum; this setup implies sensitivity to pricing and promotional cadence as the main levers for maintaining share and improving rank.
Competitive Landscape
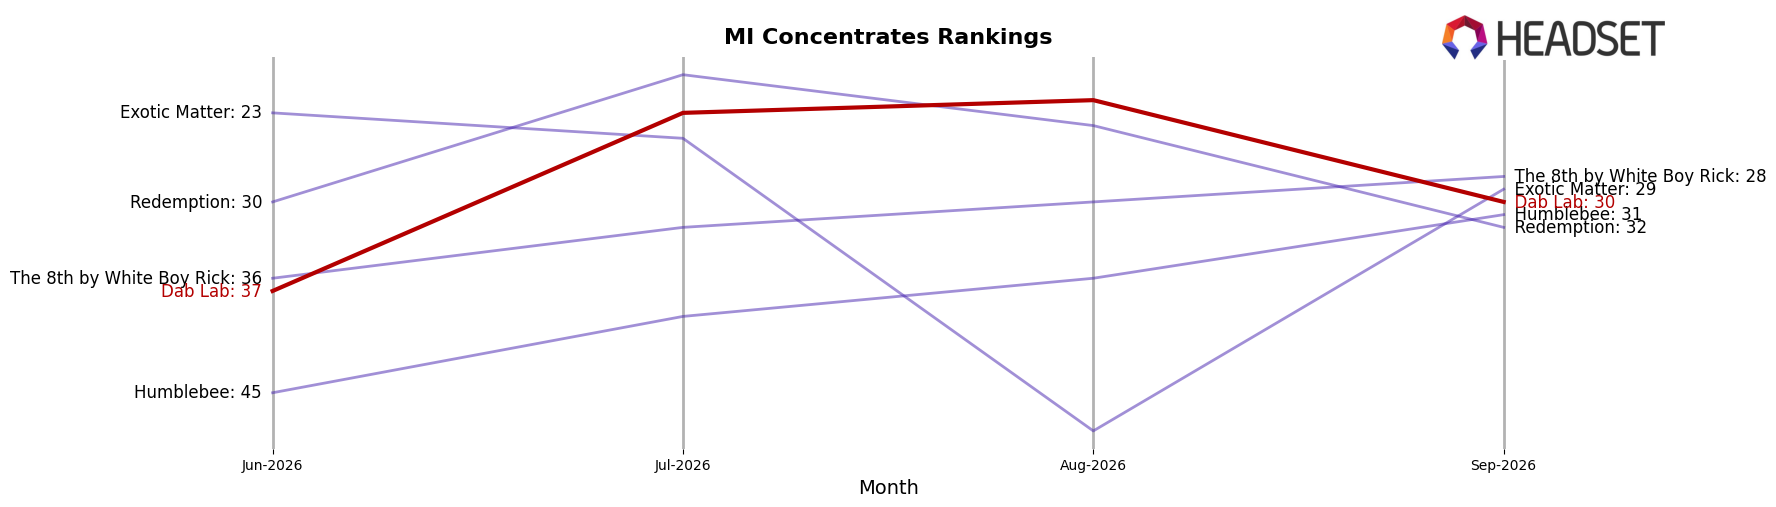
Dab Lab sits at rank #30 in MI Concentrates in September 2026 after a year-over-year jump of 140 positions from #170, and it improved 7 spots from #37 in June 2026 while briefly peaking at #22 in August 2026; by contrast, Rkive Cannabis holds #1 after rising from #3 and Uniq Pressure climbed from #96 to #3 with 2,216.9% YoY sales growth, indicating that Dab Lab’s mid-pack ascent is paced by episodic gains rather than the breakout surges propelling top rivals. This pattern implies a trajectory of recovery into the top 30 but, without sustained month-over-month rank consolidation like The Limit moving from #1 to #2 and holding top-tier position, Dab Lab is more likely to oscillate around the mid-20s to low-30s than establish a top-15 foothold.
Notable Products
Devil Driver Live Resin (15g) posted the steepest decline at -73.5% MoM while sliding to rank 9, and Spicy Badger Live Resin (15g) fell -56.6% MoM at rank 8, implying a rapid shake-out of lower-ranked SKUs even as top spots stabilize. Countering that drop, Grease Monkey Live Resin (15g) surged +134.6% MoM to rank 2 and Sour Diesel Cured Resin (15g) jumped +120.2% MoM to rank 3, with Blueberry Bang Bang Live Resin (15g) holding rank 1 as the anchor; eight of the top ten are Live Resin SKUs, signaling a concentrated bet on one format. Despite Purple Starfruit Live Resin (15g) at -43.4% and Mellowz Live Resin (15g) at -39.9%, Lemon Fresh Live Resin (15g) still grew +13.1% at rank 5 alongside a $21,578 month for the leader, indicating a split between fast-rising headliners and trailing long tail. The mix points to a portfolio tilting toward a few high-velocity Live Resin variants while pruning underperformers, concentrating share in heavyweight 15g packs over a diversified spread.
Top Selling Cannabis Brands






Data for this report comes from real-time sales reporting by participating cannabis retailers via their point-of-sale systems, which are linked up with Headset’s business intelligence software. Headset’s data is very reliable, as it comes digitally direct from our partner retailers. However, the potential does exist for misreporting in the instance of duplicates, incorrectly classified products, inaccurate entry of products into point-of-sale systems, or even simple human error at the point of purchase. Thus, there is a slight margin of error to consider. Brands listed on this page are ranked in the top twenty within the market and product category by total retail sales volume.

