May-2026
Sales
Trend
6-Month
Product Count
SKUs
Avg Price
YoY Sales Change
YoY Price Change
Market Insights Snapshot
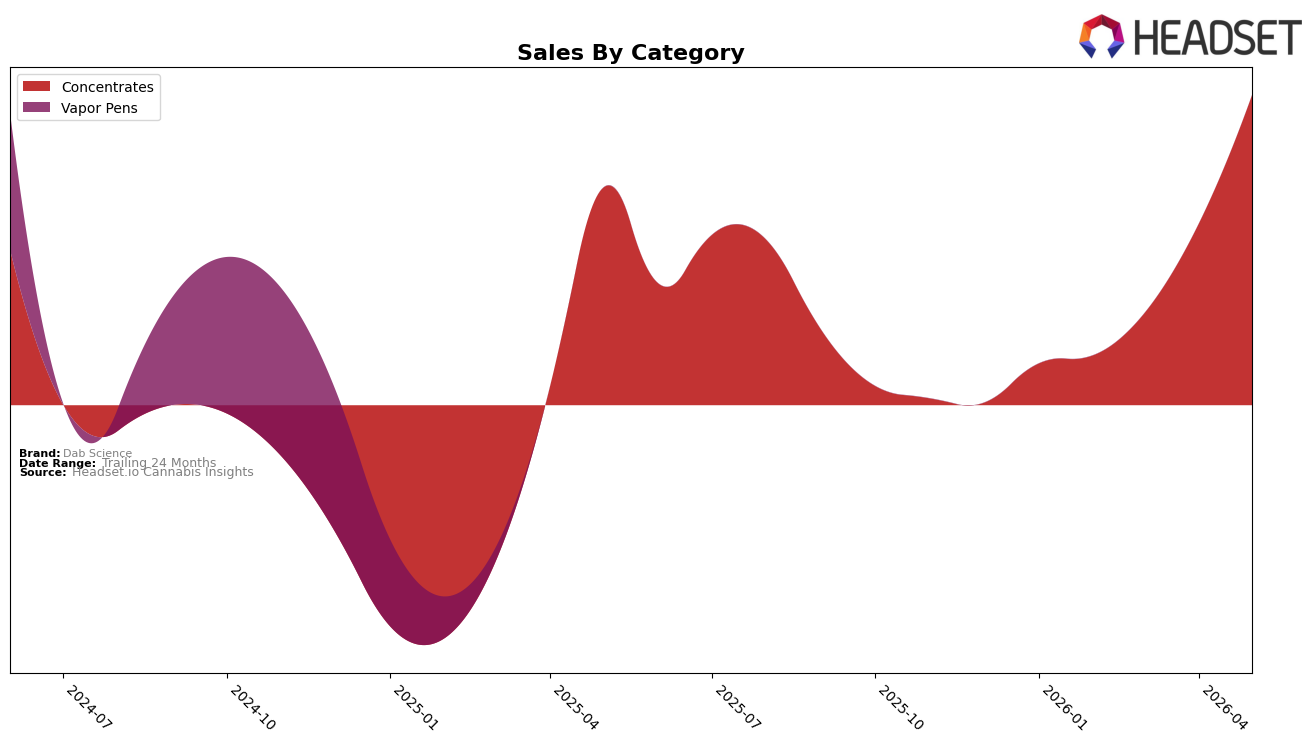
In May 2026, Dab Science operated as a single-category brand with Concentrates at 100.0% of sales share, rising 42.49% year over year and 71.04% month over month, while the brand’s average price declined 21.17% year over year to $22.52. Within Massachusetts Concentrates, the brand held rank 30, indicating a mid-pack placement despite outsized MoM acceleration and a full-category concentration; the pattern implies deliberate volume capture through price compression rather than multi-category diversification.
The combination of a 71.04% MoM sales jump alongside a 21.17% YoY price decline suggests a volume-led strategy that trades margin per unit for share momentum, and the 100.0% category concentration heightens exposure to Concentrates demand cycles. Holding rank 30 in Massachusetts Concentrates amid 42.49% YoY growth implies room to climb if the price-for-volume tactic sustains repeat purchases; the pattern implies positioning as a value-leaning Concentrates specialist rather than a cross-category brand, with future share gains contingent on maintaining velocity at current price tiers.
Competitive Landscape
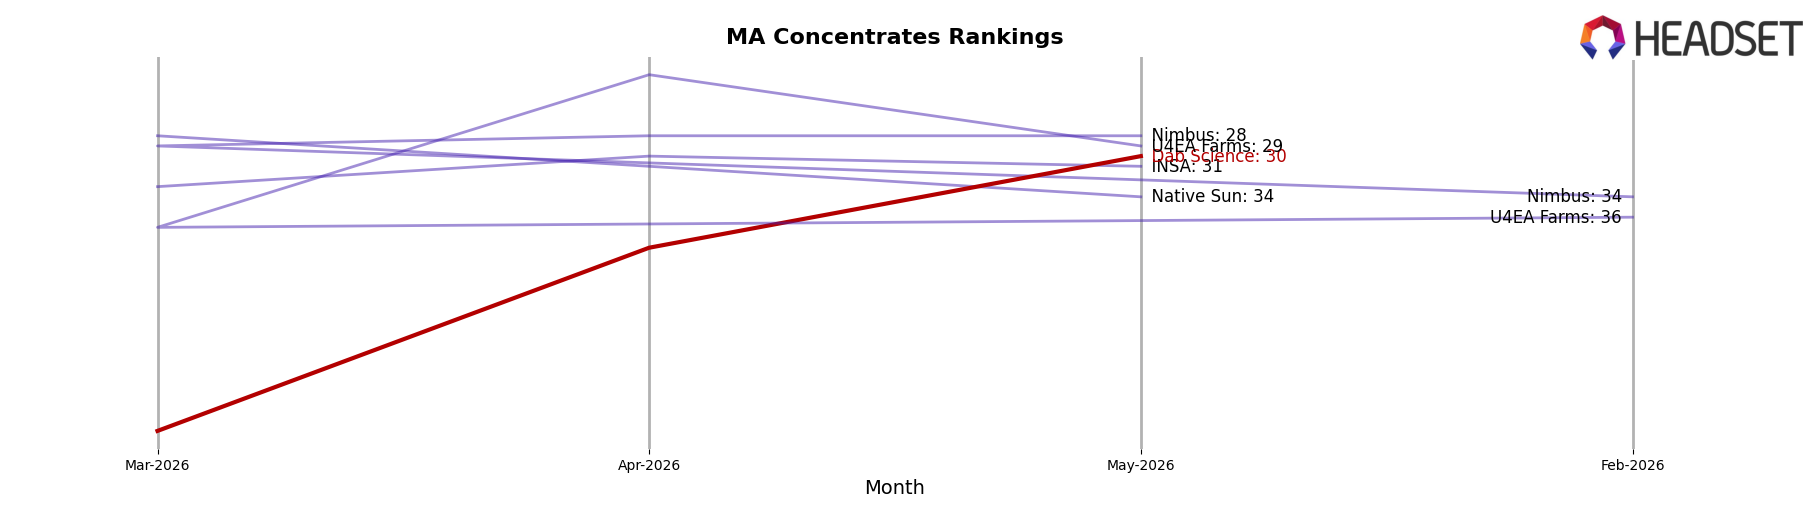
Dab Science ranks #30 in MA Concentrates in May 2026, improving 6 positions from #36 year over year and leaping 39 places from #69 in February 2026 to reach a new peak rank of #30 in May 2026; against this backdrop, Good Chemistry Nurseries held #1 year over year and remains #1 now while growing sales by 35.0%, and Harbor House Collective advanced from #17 to #5 with a 189.2% sales increase, indicating Dab Science’s rank gains are outpaced by leaders that combined rank stability with triple-digit or high-double-digit growth, which implies Dab Science’s trajectory signals recovery into the competitive set but not yet momentum sufficient to pressure the top 5.
Notable Products
Appalachian Peach Lemons Sugar (1g) posted the largest movement in May 2026 with a 148.4% month-over-month jump to rank 3, while Strawberries and Cream Sugar (1g) rose 111.7% to rank 1. Palisade Pineapple Sugar (1g) gained 50.8% and held rank 2, and four of the top six are Concentrates Sugar (1g) SKUs, indicating a concentrated lineup. The pattern implies Dab Science is leaning into Sugar (1g) variants that scale quickly up the rankings rather than diversifying formats.
Top Selling Cannabis Brands
Data for this report comes from real-time sales reporting by participating cannabis retailers via their point-of-sale systems, which are linked up with Headset’s business intelligence software. Headset’s data is very reliable, as it comes digitally direct from our partner retailers. However, the potential does exist for misreporting in the instance of duplicates, incorrectly classified products, inaccurate entry of products into point-of-sale systems, or even simple human error at the point of purchase. Thus, there is a slight margin of error to consider. Brands listed on this page are ranked in the top twenty within the market and product category by total retail sales volume.

