.svg)

Jul-2026
Sales
Trend
6-Month
Product Count
SKUs
Avg Price
YoY Sales Change
YoY Price Change


Where to Buy
Dab'Ums is stocked at 53 licensed dispensaries across Washington, with the deepest coverage in Tacoma, Spokane, Shelton, Ellensburg, and Lacey. Search by ZIP code or city below to find the closest one, or filter by product type if you are after a specific format.
Market Insights Snapshot
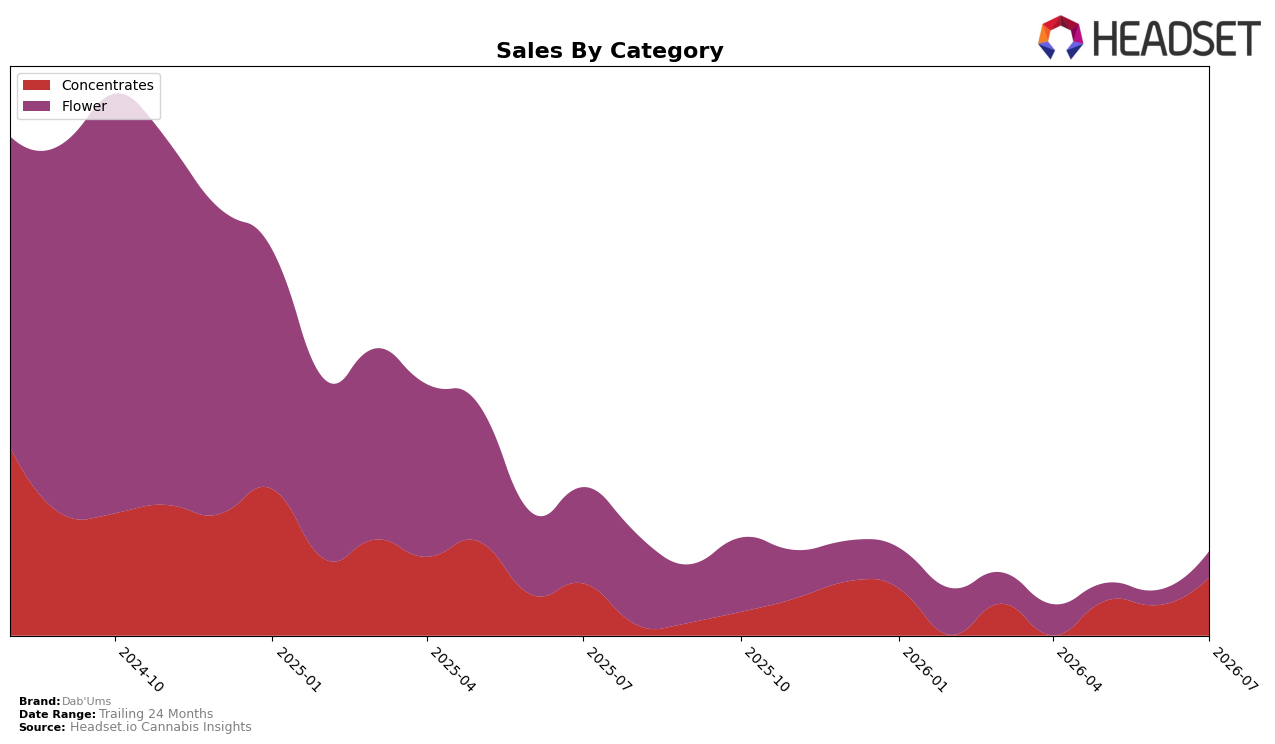
In July 2026, Dab'Ums concentrated its volume into two categories with a clear tilt: Concentrates held 54.57% share with sales up 3.12% year over year and 17.05% month over month, while Flower sat at 45.43% share but declined 30.79% year over year despite a 7.73% month-over-month lift. Average price fell 7.48% year over year to $7.90, with Concentrates priced at $5.74 and Flower at $14.44, which paired with a 17.05% month-over-month Concentrates rise and a 7.73% month-over-month Flower uptick indicates mix-driven volume cushioning against a total brand sales decline of 15.66% year over year; the pattern implies Dab'Ums is leaning into lower-priced Concentrates growth to offset Flower contraction.
Positioning-wise, a 54.57% Concentrates mix and a category rank of 48 in Washington suggest Dab'Ums is competing through depth in cheaper Concentrates (3.12% year-over-year growth) while managing a Flower reset (-30.79% year over year) that still contributes 45.43% share. With the month-over-month gains of 17.05% in Concentrates outpacing the 7.73% lift in Flower, the brand’s immediate traction comes from value-forward Concentrates rather than premium-price recovery, implying that sustaining share likely depends on reinforcing the Concentrates pipeline in Washington while selectively pruning or repricing Flower to prevent further drag on rank and margin.
Competitive Landscape
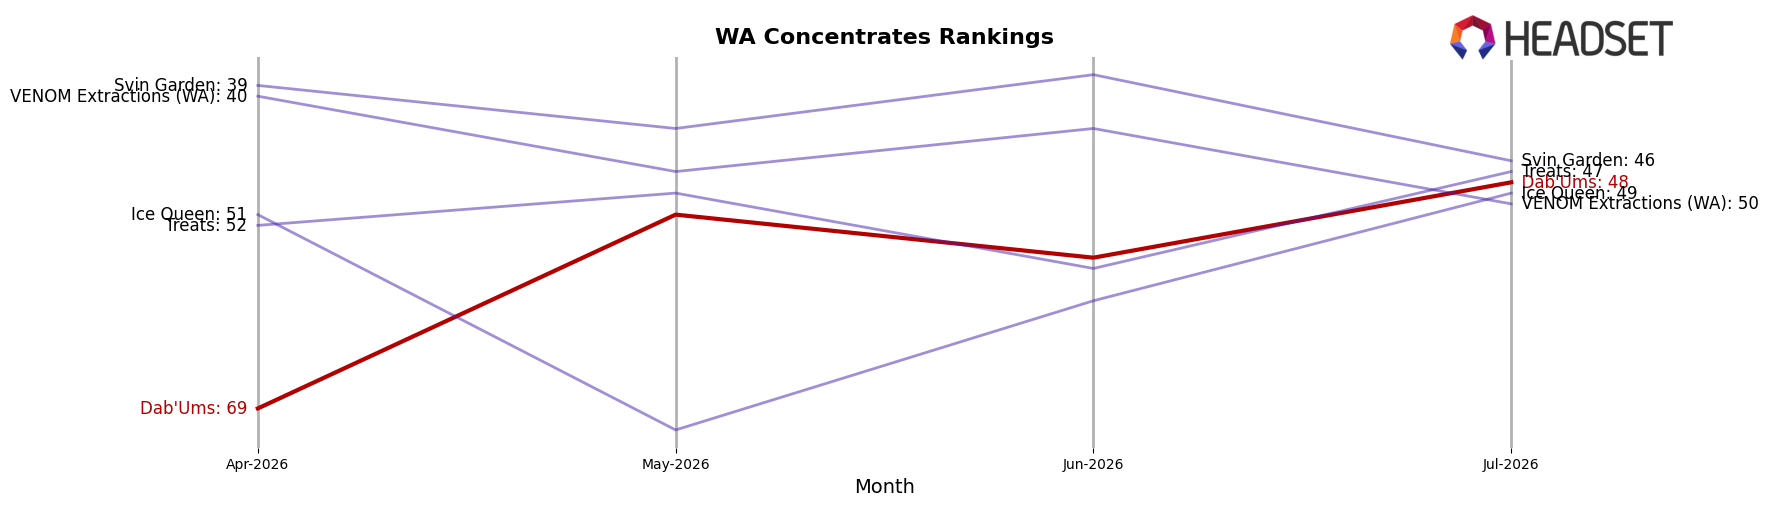
Dab'Ums sits at rank #48 in Washington Concentrates in July 2026, a 2-position improvement from rank #50 year over year, and a 21-position climb from rank #69 in April 2026, with the brand still 19 spots below its peak at #29 from August 2024; meanwhile, Ooowee held steady at #1 year over year while posting a -6.9% sales change, and Constellation Cannabis advanced from #7 to #4 alongside an 18.9% sales increase, indicating Dab'Ums is regaining placement share but remains structurally mid-pack as leaders either defend or accelerate their positions.
Notable Products
Peyote Cookies BHO Wax (1g) posted the standout move in July 2026 with an 87.7% month-over-month surge to rank 4, while White Tahoe Cookies BHO Wax (1g) fell 13.5% and sits at rank 9. Granddaddy Purple RSO (1g) held rank 1 with a 6.4% gain, and Green Crack RSO (1g) advanced 48.0% at rank 2, signaling RSO leadership even as BHO Wax re-enters the mix with momentum. Eight of the top ten SKUs are Concentrates in BHO Wax or RSO formats, concentrating demand in value-oriented dabbable formats, which implies Dab'Ums is tilting its commercial focus toward scaling a two-pillar portfolio of RSOs for stability and BHO Wax for upside.
Top Selling Cannabis Brands






Data for this report comes from real-time sales reporting by participating cannabis retailers via their point-of-sale systems, which are linked up with Headset’s business intelligence software. Headset’s data is very reliable, as it comes digitally direct from our partner retailers. However, the potential does exist for misreporting in the instance of duplicates, incorrectly classified products, inaccurate entry of products into point-of-sale systems, or even simple human error at the point of purchase. Thus, there is a slight margin of error to consider. Brands listed on this page are ranked in the top twenty within the market and product category by total retail sales volume.

